Debugging the controller
One of the major advantages that are gained by using an external controller, is the fact that they can be debugged without much effort.
Still, some things have to be considdered while doing so, which will be discussed here.
Also the procedure for debugging will be discussed for Python, Simulink and Labview.
1 Adjusting Timeout in Ashes
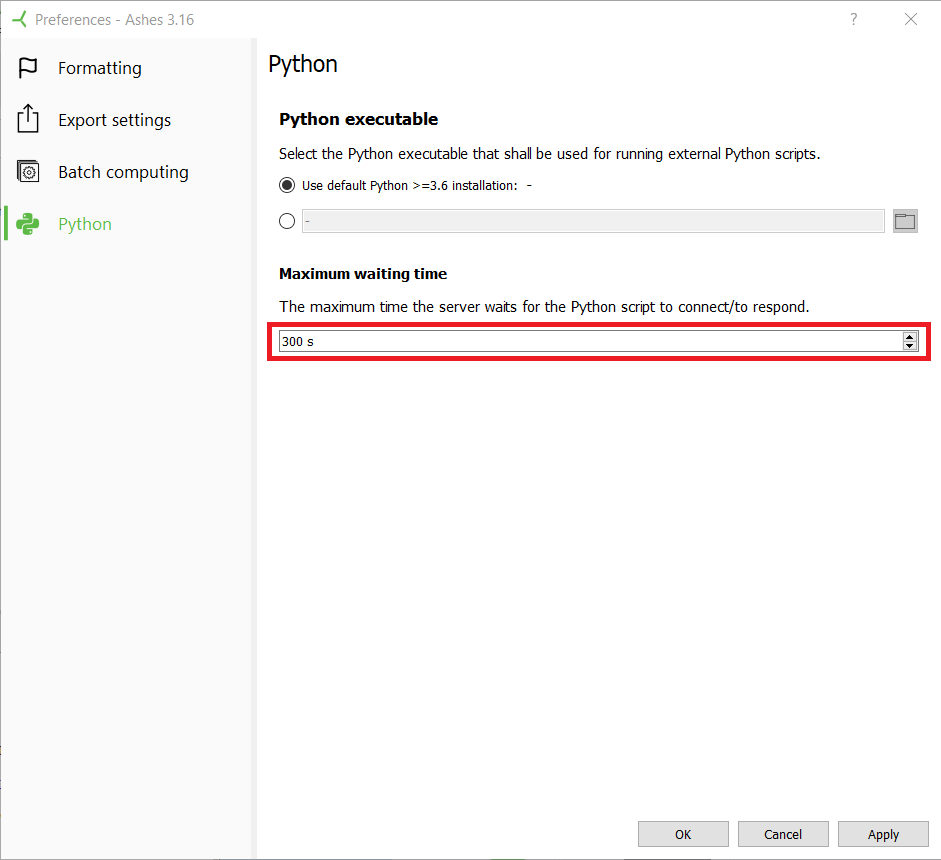
When an external Controller is used, Ashes will wait a certain amount of time for an answer each timestep before the connection is aborted. If you want to debug the controller, this timeout has to be sufficiently long, so that multiple timesteps can be debugged. This timeout can be adjusted in the
Preferences Window under Python. We suggest a minimum timeout of 300 seconds when debugging, but also bigger timeouts will work without problems.
2 Debugging in Python
To effectively debug Python we suggest a modern IDE such as Visual Code or PyCharm that offers debugging capabilities.
Common features are:
- Setting breakpoints that pause execution at the specified line (Marked with a red dot, by clicking next to the line in the editor). These breakpoints can also be adjusted so that they only trigger under certain conditions (For example x > 15, with x being a variable in the code)
- Looking at the current value of variables when paused.
- Editing these values
- Stepping through the code line by line
3 Debugging in Simulink
Debugging Simulink can be done in multiple ways.
For example,
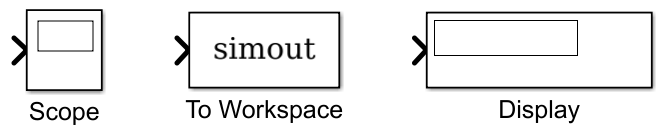
Scopes
and
Displays
can be used to directly show timeseries and values or data can be sent
To Workspace
in MATLAB.
Another method is to use the built-in
Simulation Data Inspector
in Simulink (See
https://de.mathworks.com/help/simulink/ug/populate-sdi-with-your-data.html)
It is also possible to go through the simulation step by step, by using the
Step Forwards
button or built-in
debug tool. The latter enables you to set breakpoints or steo through the simulation from the start. In the meantime, relevant values can be logged and seen.
For more information refer to
https://de.mathworks.com/help/simulink/ug/using-the-debuggers-graphical-user-interface.html.
4 Debugging in LabVIEW
LabVIEW offers several different ways of debugging models.
This can be done by creating appropriate
displays in the Front panel
of the Simulink Model.
Another way is to attach
Probes
to wires (Right-Click Probe) or by setting
break points
on them. The latter enables you to step trhough the simulation in your own pace and watch values on wires using Probes.
For more information visit
https://www.ni.com/getting-started/labview-basics/debug.