Variable speed generator
This section is a test illustrates how the parameters in the
Variable speed
part define the
Torque vs RPM curve
for the generator. The Torque vs RPM curve describes the generator torque depending on the generator RPM. In order to illustrate how the parameters in the Variable speed part define this curve, we will here take the example of the generator for the NREL 5 MW turbine, which definition can be found in
Jonkman et al. (2009o)
.
1 Optimal curve
Here we assume that the turbine is constantly working under optimal conditions, which means that the power produced is given by the following equation:
$$P=\frac{1}{2}\cdot C_{P,max}\rho A v^3$$
where
-
$$\rho$$is the air density
-
$$A$$is the projected area of the rotor
-
$$v$$is the wind speed
-
$$C_{P,max}$$is the maximum power coefficient of the rotor
We now include the tip speed ratio in the equation. The tip speed ratio is given as
$$TSR = \frac{\frac{2\pi \omega_r}{60}r}{v}$$
, where
$$\omega_r$$
is the rotational speed of the rotor, in revolutions per minutes (RPM) and
$$r$$
is the rotor radius.
The gearbox ratio of the NREL 5 MW turbine is 97, so the TSR can be expressed with the generator RPM as
$$TSR = \frac{2\pi \omega_{g}\cdot r}{97\cdot 60\cdot v}$$
By expressing the wind speed in terms of TSR and inserting the expression in the equation for power, we obtain
$$P = \frac{1}{2}\cdot C_{P,max}\rho A\left(\frac{2\pi\cdot r}{97\cdot 60 TSR}\right)^3\cdot \omega_g^3$$
The power and the generator torque
$$T$$
are linked through the equation
$$P = T\cdot\omega_g\frac{60}{2\pi}$$
(note that in this equation the rotational speed must be given in
$$rd\cdot s^{-1}$$
). This yields the following equation for the optimal torque
$$T_{opt}=K_{opt}\cdot\omega_g^2$$
with
$$K_{opt} = \frac{1}{2}\cdot C_{P,max}\rho A\left(\frac{r}{97\cdot TSR}\right)^3\left(\frac{2\pi}{60}\right)^2$$
By entering the values found in
Jonkman et al. (2009o)
, we obtain
$$K_{opt}=0.02557 Nm\cdot RPM^{-2}$$
. This gives the following
optimal torque
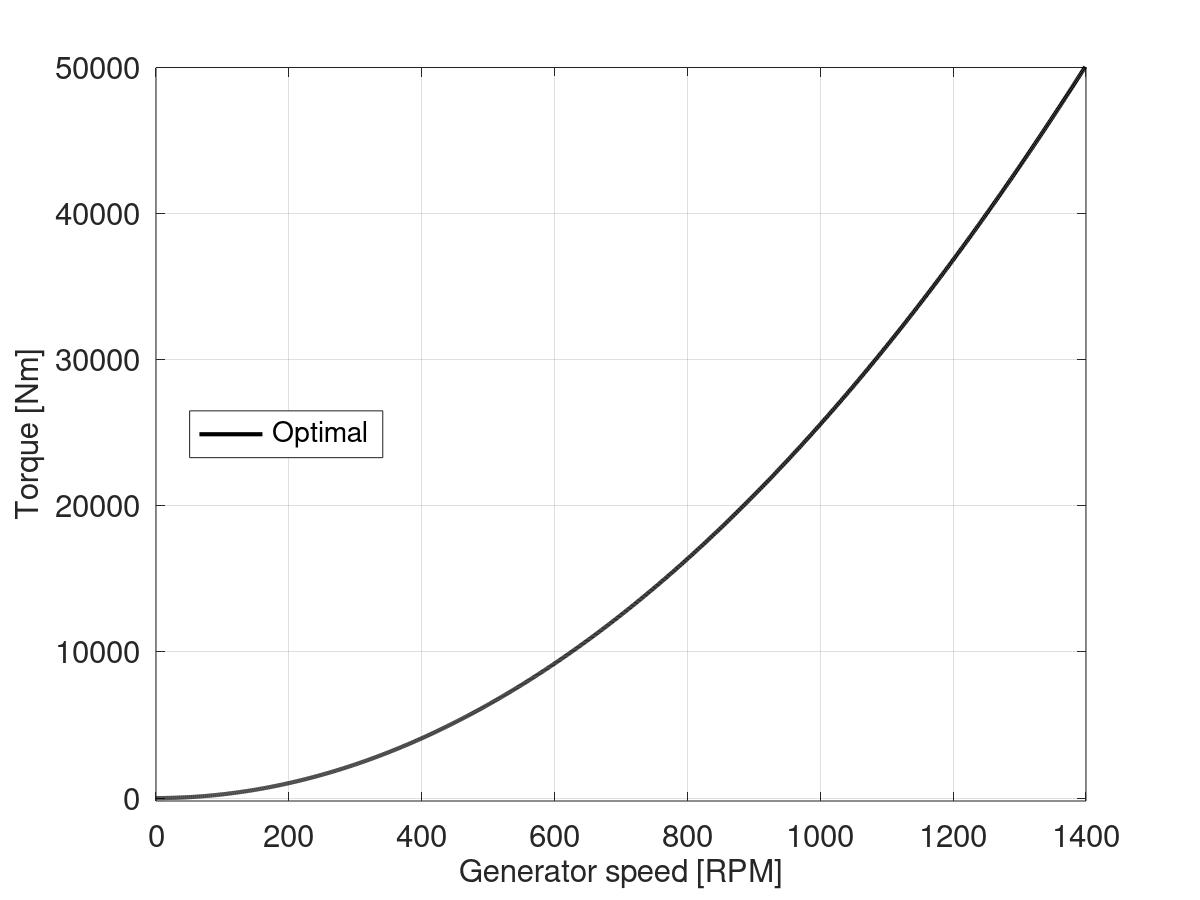
curve, i.e. the curve corresponding to a strategy where the optimal power coefficient is achieved at all times:
2 Region 1
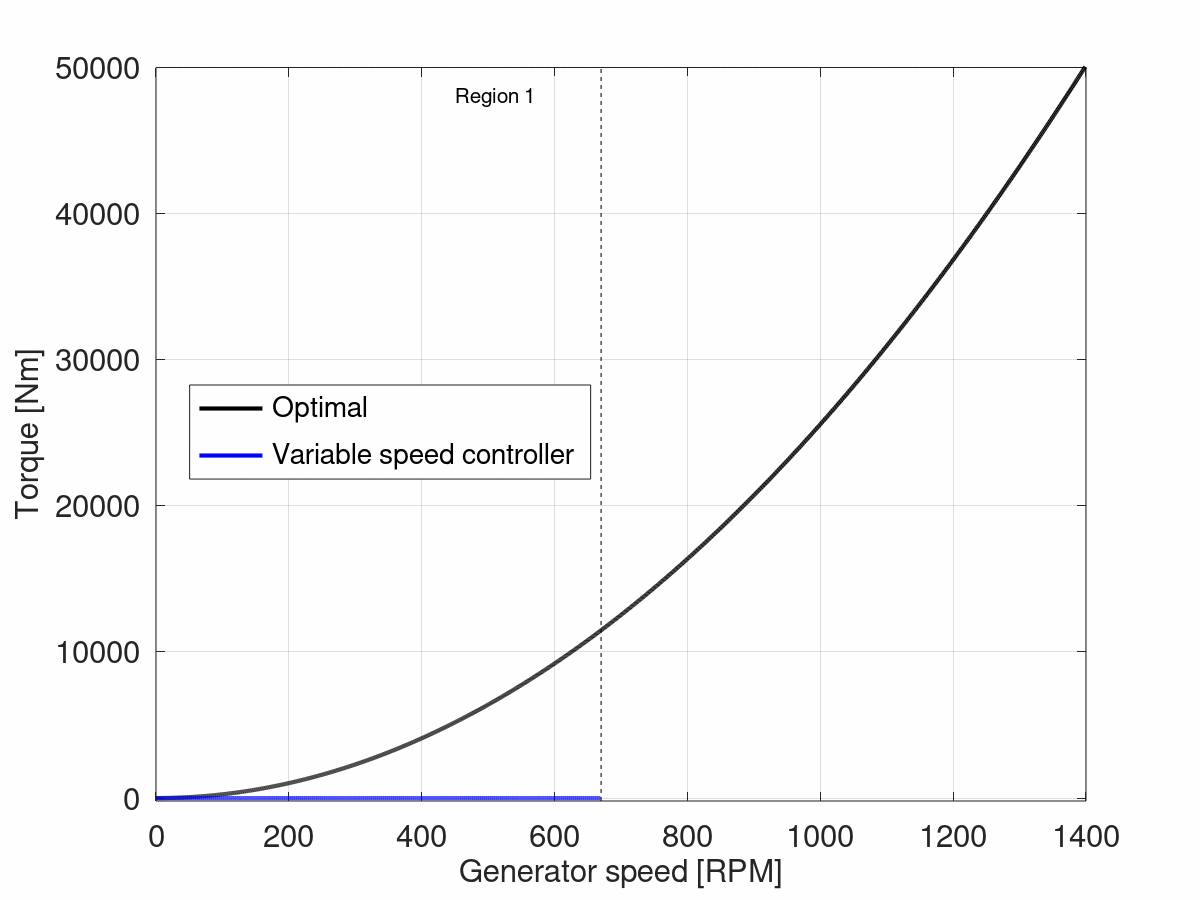
For low rotational speeds, the generator does not produce any torque. This range of rotational speeds is called
region 1
, and in the case of the NREL 5 MW goes from 0 to 670 RPM. The torque vs RPM curve for the generator in this region will be flat, as shown in the following figure:
In Ashes, the upper limit of region 1 is given by the parameter
Transition RPM region 1 to 1.5
, and is defined as a percentage of the rated generator speed. For the NREL 5 MW turbine, the rated generator speed is 1173.7 RPM, so the value of the
Transition RPM region 1 to 1.5
parameter will be 57.08%. The lower limit is always 0.
3 Region 1.5
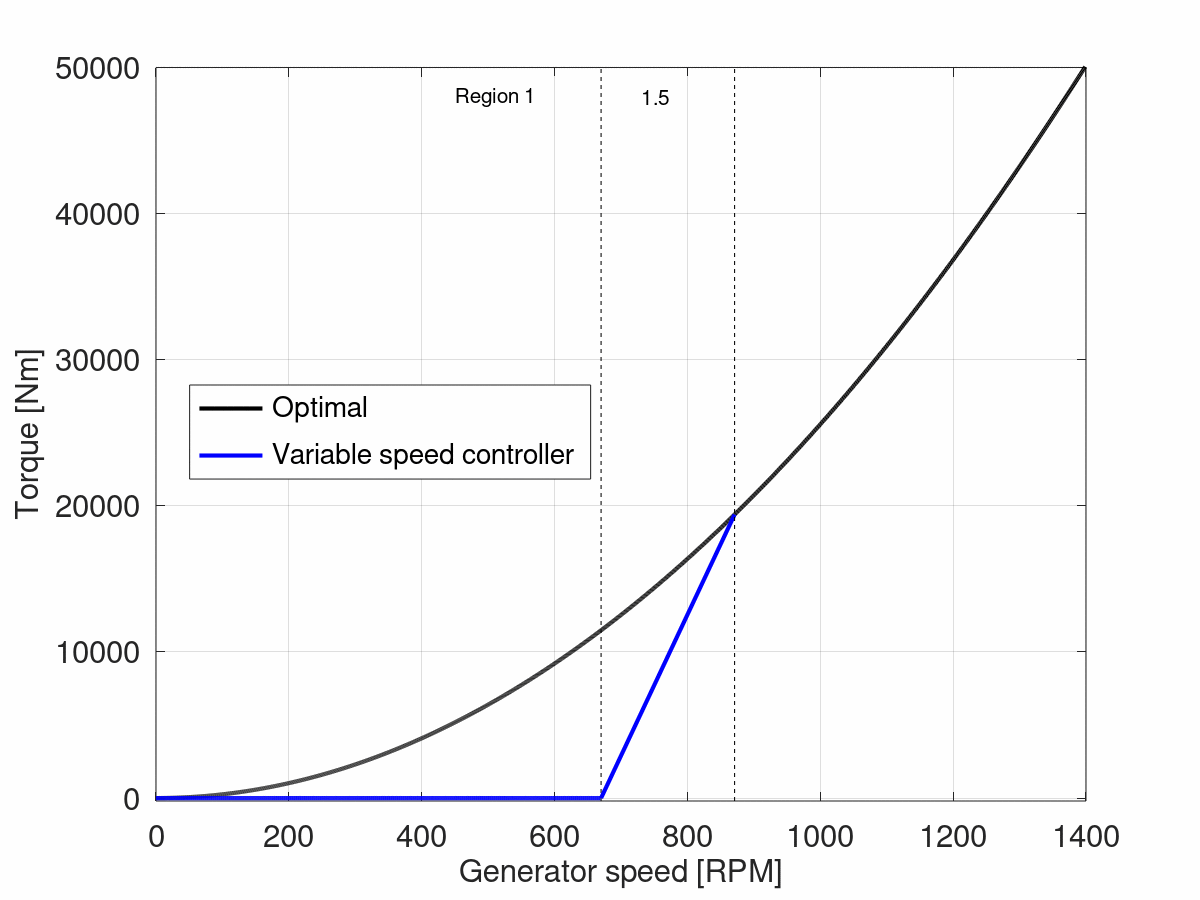
In region 1.5, the curve varies linearly from 0 to the optimal torque curve. For the NREL 5 MW turbine, the upper limit of region 1.5 is 871 RPM, which gives the following curve:
In Ashes, the upper limit of region 1.5 is given by the parameter
Transition RPM region 1.5 to 2,
and is defined as a percentage of the rated generator speed. For the NREL 5 MW turbine, the rated generator speed is 1173.7 rpm, so the value of the
Transition RPM region 1.5 to 2
parameter will be 74.21%.
4 Region 2
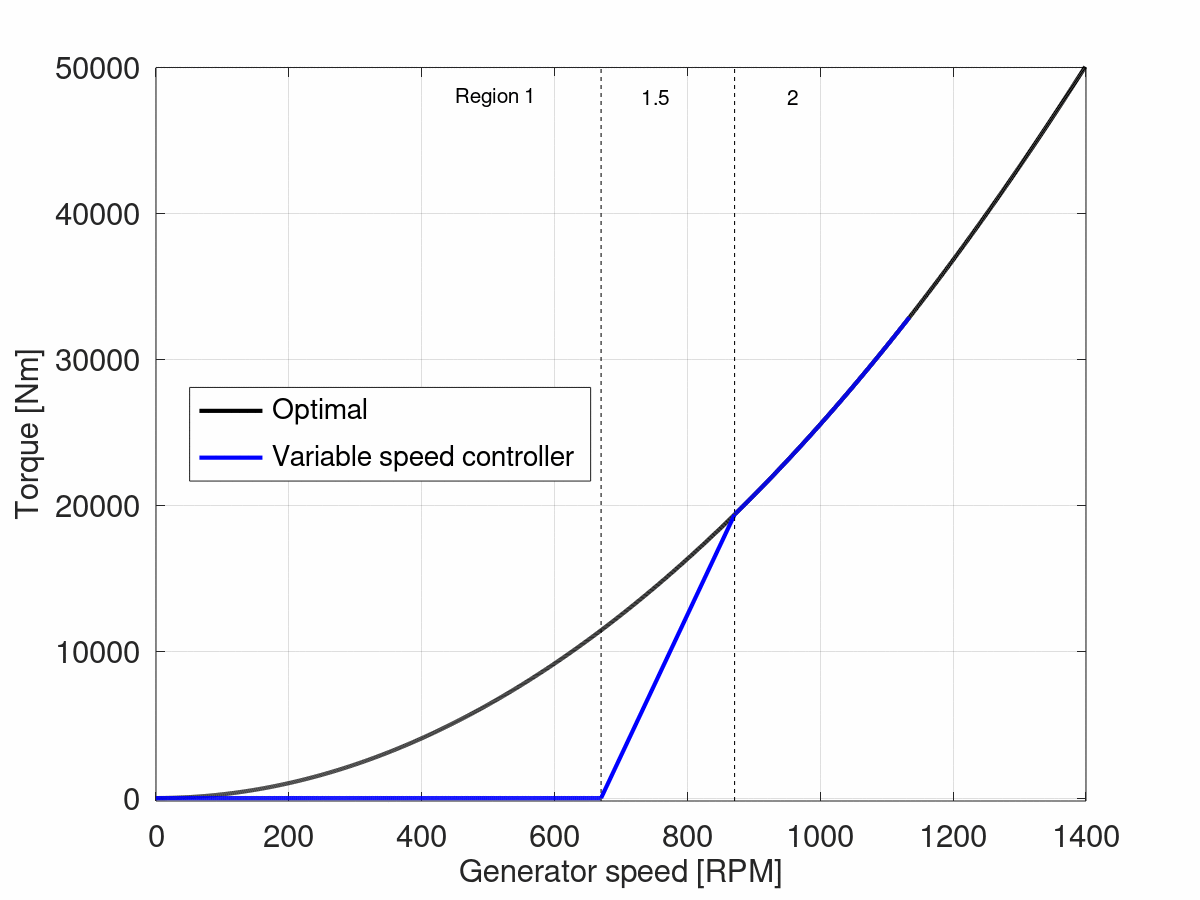
In region 2, the curve follows the optimal torque curve, so that the turbine is operating at the maximum power coefficient. The curve will look as follows:
The upper limit of region 2 is defined as the lower limit of region 2,5, which will be calculated in the next section.
In Ashes, the value of the
$$K_{opt}$$
coefficient which defines the optimal curve is given by the parameter
Proportionality factor region 2
, and is defined as a percentage of the ratio of the rated torque over the rated rpm squared. Since the rated rpm is 1173.7, the rated torque is 43093 Nm and we found earlier that
$$k_{opt}=0.02557 Nm\cdot RPM^2$$
, this means that the
Proportionailty factor region 2
parameter will be
$$0.02557/\frac{43093}{1173.7^2}=81.76\%$$
5 Region 2.5
Region 2.5 is another linear region. In the NREL 5 MW case, its upper limit corresponds to 99%. Because this is the transition point to region 3, the power produced at this point will be equal to the rated power. Note that here we talk about
mechanical power
, rather than
electrical power
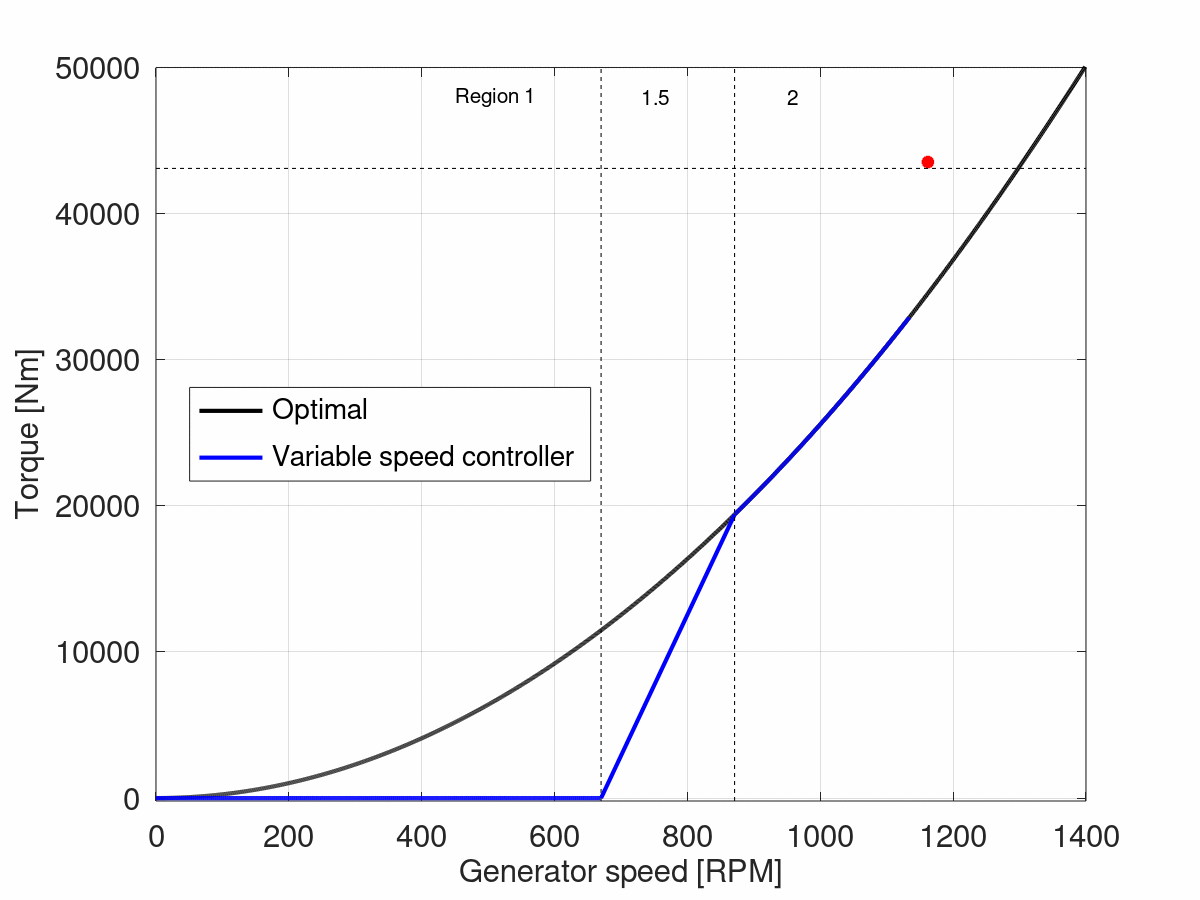
. The difference between the two is due to the generator efficiency. In the case of the NREL 5 MW turbine, a rated electrical power od 5 MW and a generator efficiency of 94.4% give a rated mechanical power of 5.29661 MW. The torque produced at the upper limit of region 2.5 will therefore be
43528 Nm
. Note that this is 1% higher than the rated torque, since we are producing rated power at 99% of the rated speed.
The figure below shows the upper limit of region 2.5 as a red dot, and the rated torque as a horizontal dotted line.
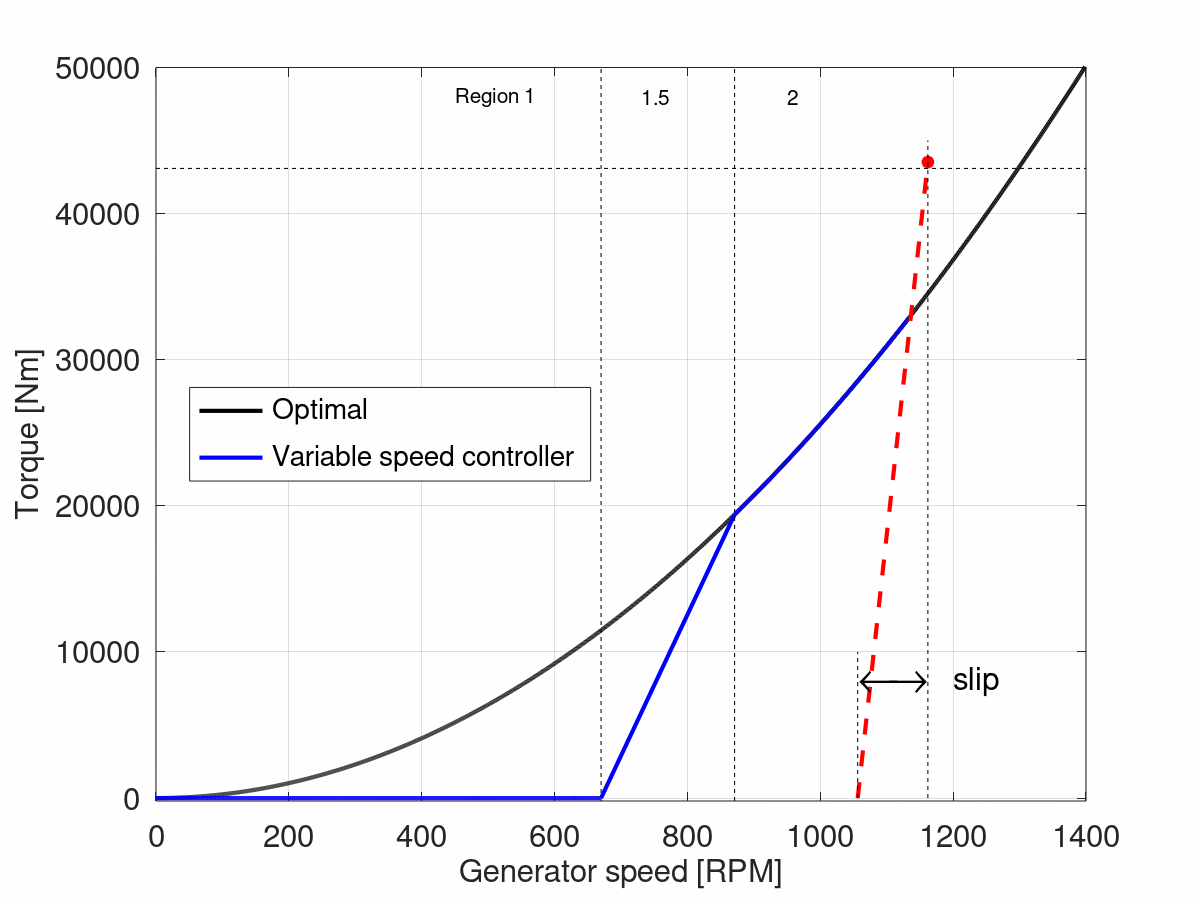
In order to find the lower limit of region 2.5, the slope of the linear curve is calculated first, such that it intersects the x axis at an RPM corresponding to the
generator slip
. In the NREL 5 MW case, the generator slip is 10%, which means that the linear curve of region 2.5 will intersect the x axis at an RPM 10% lower than the rated RPM, so
1056.33 RPM
. This is illustrated by the red dotted line in the figure below:
The lower limit of region 2.5 (which is also the upper limit of region 2) is then taken as the intersection of the red line and the optimal torque curve, as shown in the figure below:
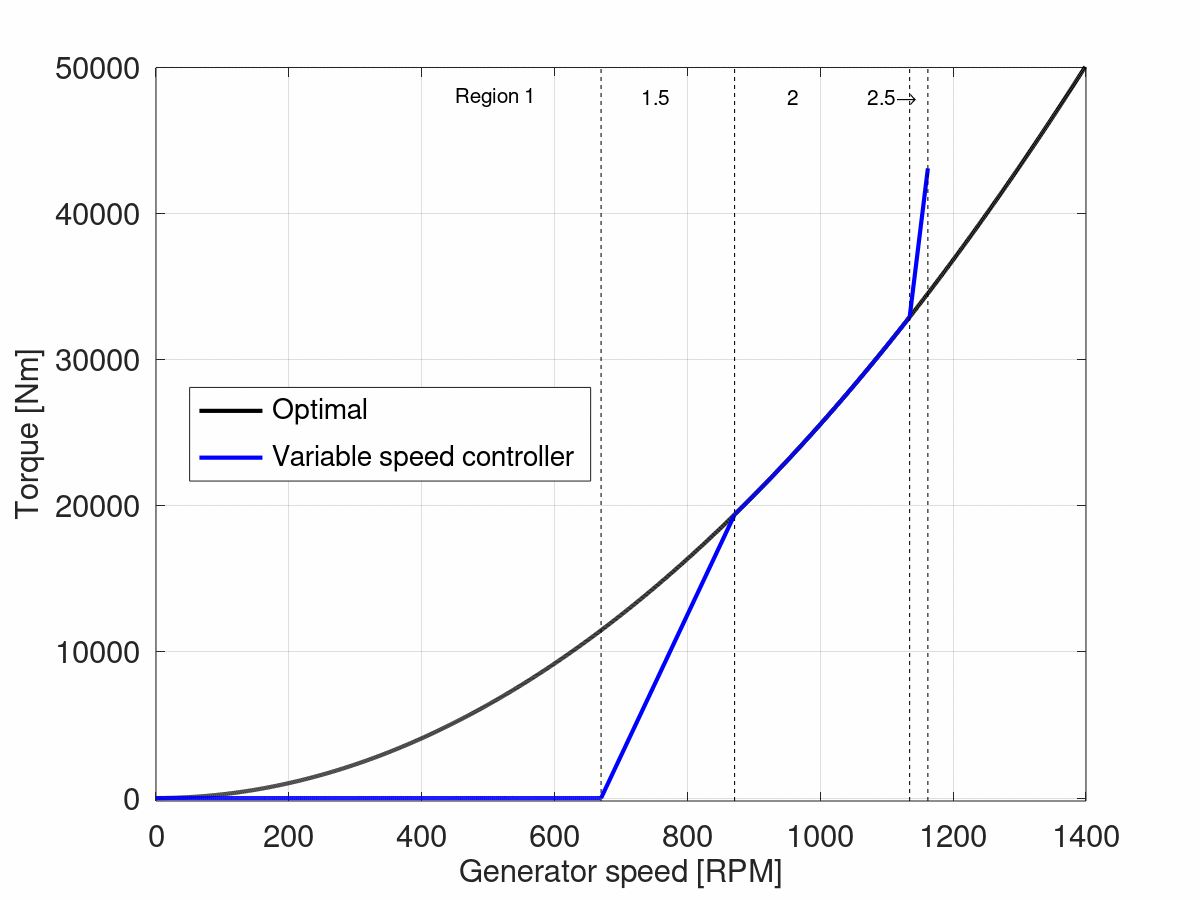
In Ashes, the upper limit of region 2.5 is defined by the parameter
Transition RPM region 2.5 to 3
, as a percentage of the rated speed. The slope of region 2.5 is calculated based on the
Slip
parameter as explained above.
6 Region 3
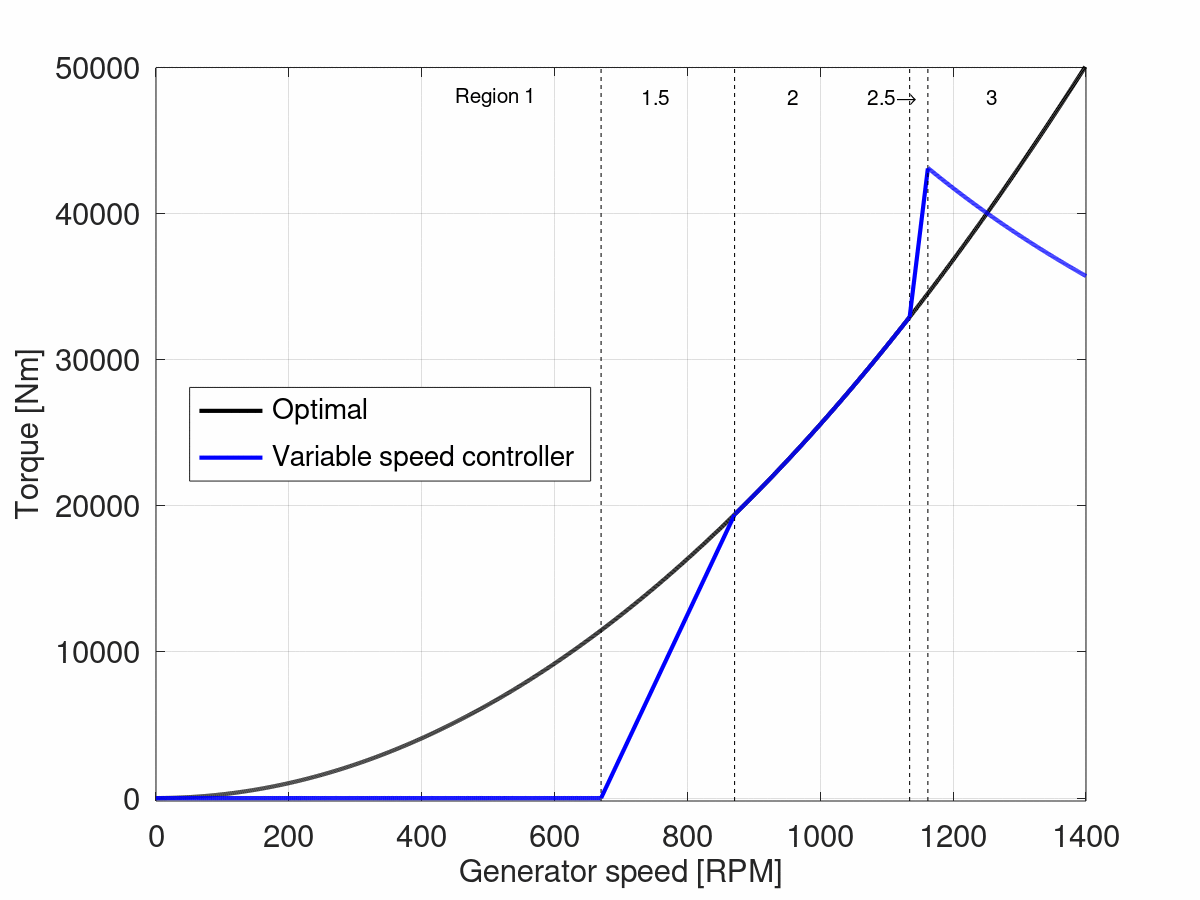
In region 3, the blades start pitching to maintain a constant power output. Using the relationship established earlier, the torque in this region is then defined as
$$T = \frac{60\cdot P}{2\cdot\pi\omega_g}$$
. The torque vs RPM curve is then as follows:
A Matlab script to produce the Torque vs RPM curve from Ashes parameters can be downloaded from
here
.