OC4 Phase II
1 Test description
In Phase II of the OC4 project, the
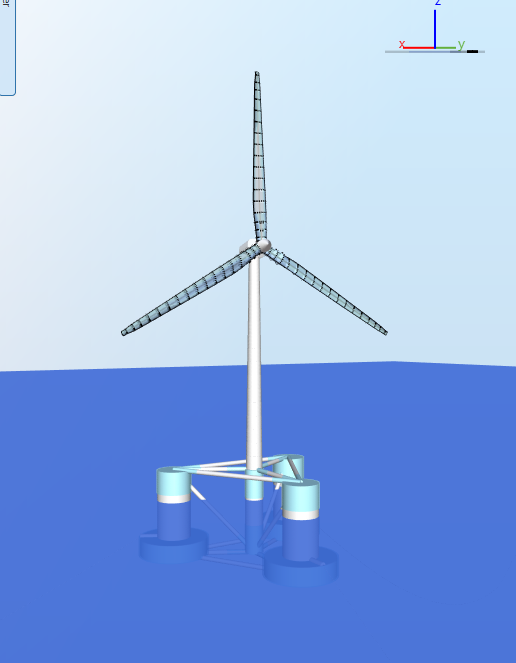
NREL 5-MW reference wind turbine is mounted on a semisubmersible floater. The objective of the project was to compare how different aeroelastic software can model floating offshore wind turbines (
Robertson et al. (2014g))
2 Model
This test uses the
Floater semisubmersible template
Note that
2 models are used in this test: with one model, the loads are calculated using
Morison equation and with the other one they are computed with the
Potential flow theory. When refering to the potential flow model, the abbreviation PF will be used.
The model used for this test in shown in the figure below:
3 Benchmarks
The results from the different participants as well as a detailed definition of the load cases and sensors can be found on
this link.
A brief summary of the load cases simulated in Ashes is given below:
- LC13a-d: no waves, no wind, decay test in Surge, heave,pitch and yaw, respectively
4 Benchmarks
Since this is a code to code comparison, there is by definition no correct result, the objective is to match as closely as possible the other participants of the project. However, the spread among participant is very wide and there are several outliers, which makes it hard to define the values that Ashes should be aiming for.
Therefore, there is no automatic fail/pass criteria on these benchmarks, only a visual inspection is performed.
4.1 LC13
This report can be downloaded in the following links:
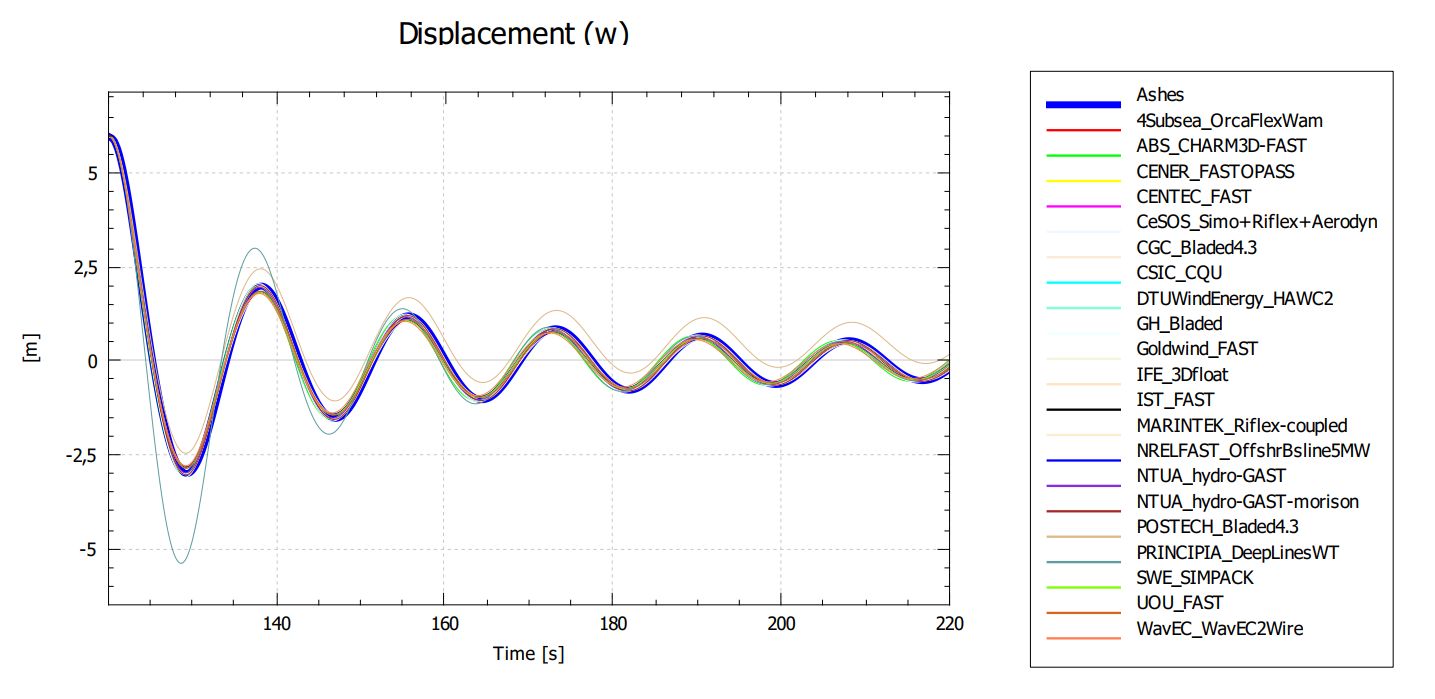
In this reports, the tensions in the mooring lines, the internal loads within the top and bottom element of the tower and the motion of the floater are verified. Note that the motion of the floater is taken as the motion of the node at the centre of mass of the floater.
Note that in the results presented by the participants, the displacement at the instant when the floater is released is 0 for all degrees of freedom. We did not attempt to reproduce this and only focussed on the degree of freedom corresponding to the decay test. For example, LC13b is a
Heave decay test, therefore the vertical position of the floater is so that it matches the other participants at the release instant, but that is not necessarily the case for other degrees of freedom.
For example, the Heave displacement (corresponding to the w-displacement of the CM node) exhibits virtually a perfect match, as shown in the figure below:
However, the Surge displacement (corresponding to the u-displacement of the CM node does not have the same starting point as the rest of the participants, as shown below:
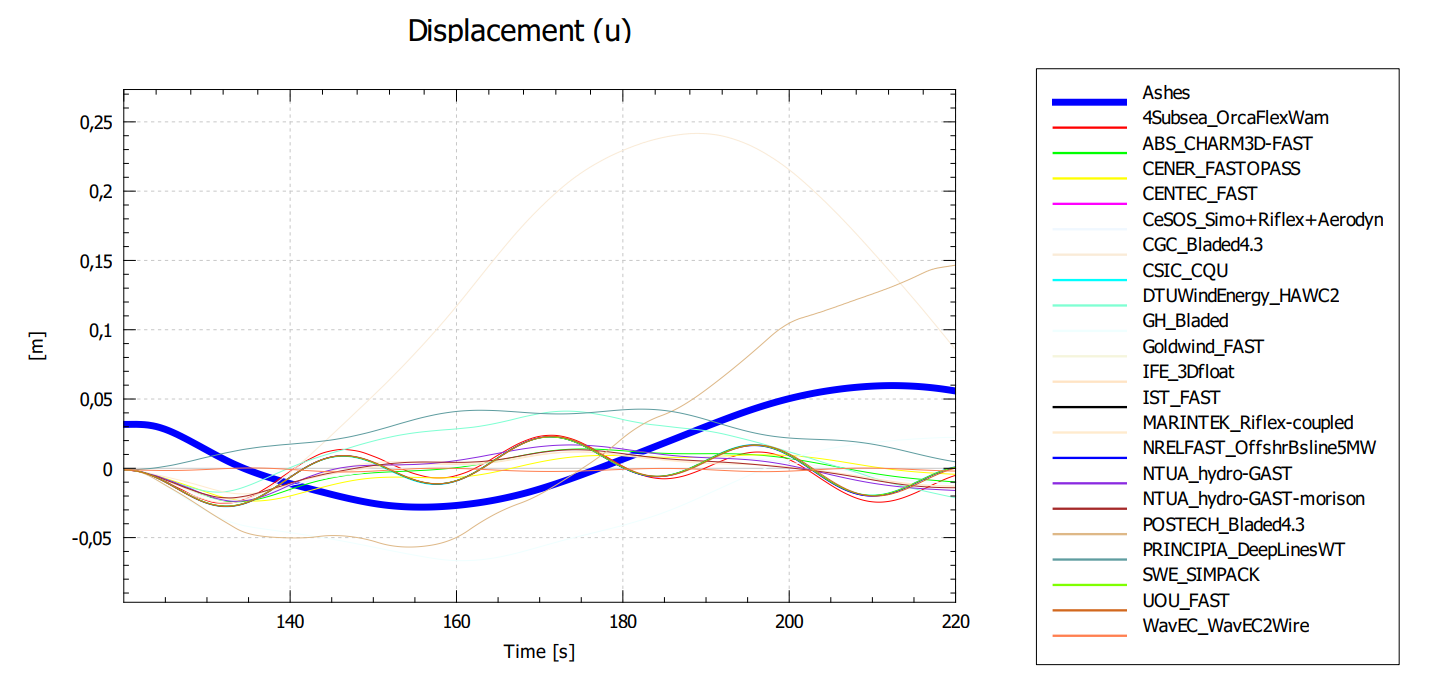
It should also be noted that we did not perform any tuning of drag coefficients or masses and inertias (for the PF model) to match the rest of participants. If such tuning was performed, it is expected that the results would match even better.
Once the visual inspection is performed, to ensure that the results are always valid, a regression test is performed for each case. The report from the regression test can be downloaded from the following links: