IEA 15-MW steady state performance
In this document we compare results produced by Ashes with the
IEA 15-MW twind turbine for constant uniform wind speeds ranging from 4 to 25 m.s-1.
1 Model
The model used for the benchmark corresponds to the RNA of the
IEA 15-MW reference wind turbine. The document
Reference models shows how to generate this model in Ashes. Note however that
stiff blades instead of flexible blades are used.
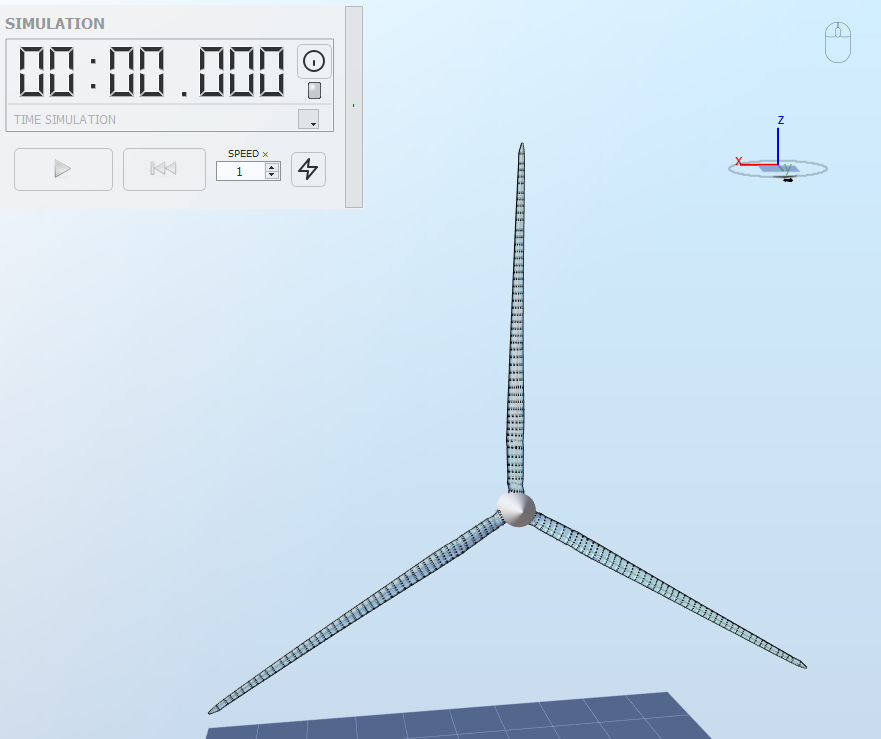
The figure below illustrates the model:
2 Benchmarks
Constant uniform wind speeds ranging from 4 to 25 m.s-1 are used as environmental conditions. Each wind speed corresponds to a load case. For each load case, 300 seconds are run and the value of the
RPM,
Demanded collective pitch angle,
Power coefficient (CP),
Tip speed and
Power (electrical) are extracted. These outputs are part of the
Rotor sensor and the
Generator sensor. These results are benchmarked against figure 3.1 of
Gaertner et al. (2020).
Note: the numerical values used in this benchmark are available on the GitHub repository at
https://github.com/IEAWindTask37/IEA-15-240-RWT/blob/master/Documentation/IEA-15-240-RWT_tabular.xlsx
3 Results
The report with the results can be downloaded here:
We also run this test for the IEA 15-MW blade with rotational inertia. The report for this test can be found here:
For each output in each load case, only the last fifth of the time series are considered to ensure that transients are not taken into account. A test is considered passed if the results produced by Ashes are within 10% of the benchmark.
The Collective pitch angle can be equal to 0, which means that taking a relative difference could yield infinite values. Instead, we take the absolute difference of the two time series and normalise it against the largest value of the time series. The test is considered passed if this normalised difference is within 10%.
Above rated wind speeds, for the electrical power, we expect a closer match between Ashes and the benchmark. Thus, for electrical power, aerodynamic torque and RPM, the test is considered passed if the differnece is within 1%.
Note that there are two sources of differences between the results produced by Ashes which require special attention, and which are detailed in the subsections below.
3.1 Rated Cp
When plotting the Cp over TSR curve for the IEA-15 MW rotor in Ashes, it appears that the design power coefficient Cp = 0.489 is not reached for a TSR of 9 as specified in
Gaertner et al. (2020) but rather for a TSR of 8.62. This is illustrated in the figure below.
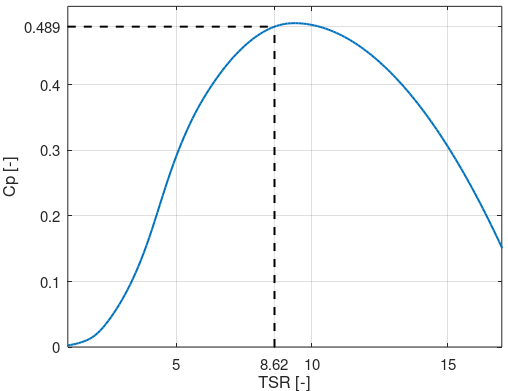
This suggests that rated power is achieved at a slightly lower wind speeds in Ashes than in the specification document, meaning that the blades will start pitching earlier. Similarly, to keep a constant RPM at low wind speeds as specified in the report, the model in Ashes will have to keep its blades pitch for slightly higher wind speeds. This is illustrated in the figure below:
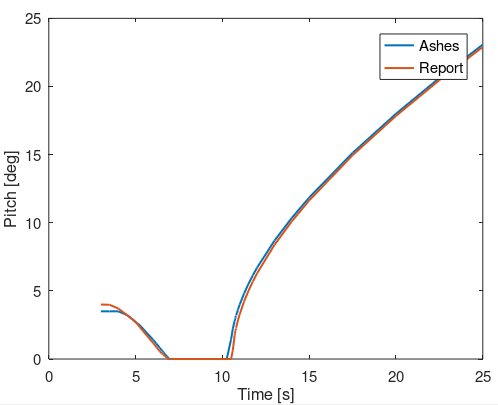
For these reasons, larger pitch angle relative differences are expected for winds of 6 and 11 m/s, when the pitch angle is small. For these two wind speeds, the test is considered passed if the values from Ashes are
within 20%
of the values in the report.
3.2 Ct at high Tip Speed Ratios
The controller strategy for the IEA 15-MW wind turbine requires keeping a constant rotational speed of 5 RPM at low wind speeds (below 7 m/s). This is done to ensure that the 3P frequency does not interact with the 1st eigenmode of the support structure. This implies that at low wind speeds, the rotor will be operating at TSRs up to 20. At such TSRs, the influence of the Glauert correction on the thrust coefficient is significant. The figure below illustrates the Ct curve for different values of the Critical Glauert's value.
As far as we could find, there is no information on what Critical Clauert's value or what theory for the Glauert correction was used when generating the values provided in the GitHub repository. However, we do know that Aerodyn and Ashes use different equations to apply the Glauert correction (you can find about the one in Ashes in the
Steady BEM document). For this test, the
Critical Glauert's value is set to 0.4.
The figure below compares the Ct curves from the report to that obtained from Ashes. This illustrates the large difference in thrust coefficients at low wind speeds.
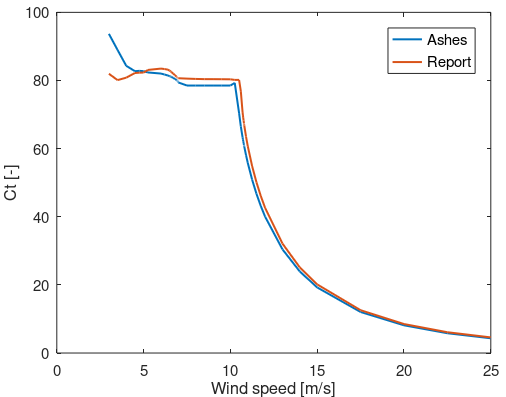
For this reason, the load case at 3 ms wind speed is not run.