$$\Delta\sigma_C$$
Eurocode1993 S-N curves
This document shows how to obtain the Eurocode1993 S-N curves (see
EN 1993-1-9 (2005)) from the
category
as given in the
Preferences in Ashes.
Note:
the category as defined in the Eurocode is a number that corresponds to the stress that gives 100% damage at two million cycles. This value is called
reference stress and is noted
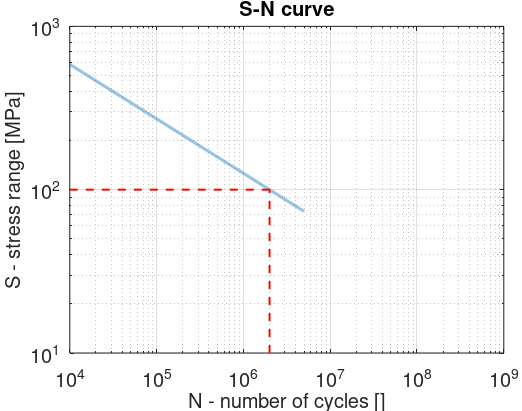
1 First region
In the first region, corresponding to
$$N<5\cdot10^6$$
, the equation for the curve is
$$S=N^{m_1}\cdot a_1$$
In this region,
$$m_1$$
is given as being equal to
$$-1/3$$
.
$$a$$
can be found following the definition of the
category of the curve. In this example, we are defining the
category 100
curve. This means that for a stress
$$S_1 = 100\text{ MPa}$$
, we have
$$N_1 = 2\cdot10^6$$
cycles. This yield
$$a_1 = \frac{100}{(2\cdot10^6)^{-1/3}}$$
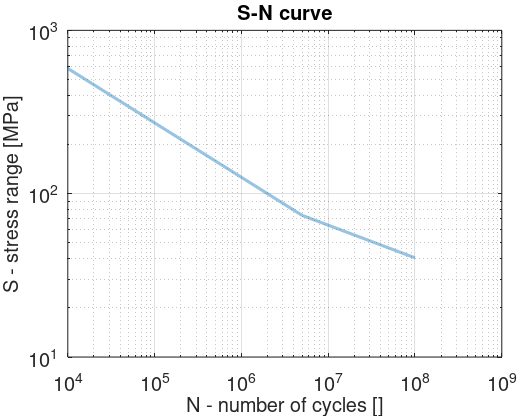
2 Second region
In the second region, corresponding to
$$5\cdot 10^6
, the equation for the curve is
$$S=N^{m_2}\cdot a_2$$
In this region,
$$m_2$$
is given as
$$-1/5$$
.
The lower limit of region 2
$$N = 5\cdot10^6$$
corresponds to the upper limit of region 1, which yields
$$N_{12}^{m_2}\cdot a_2=N_{12}^{m_1}\cdot a_1$$
Solving for
$$a_2$$
gives
$$a_2=a_1\cdot N_{12}^{(m_1-m_2)}$$
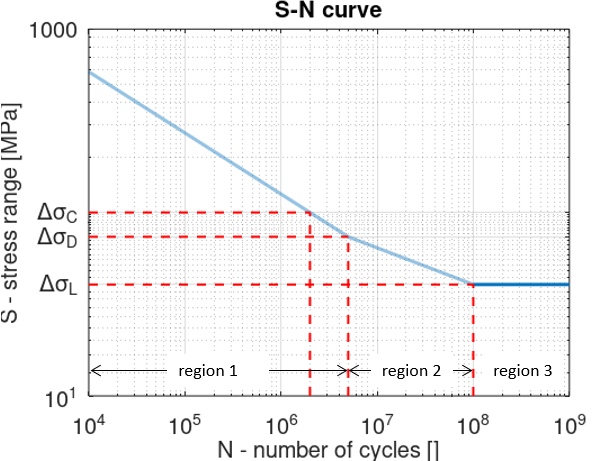
The first and second region correspond to the following graph:
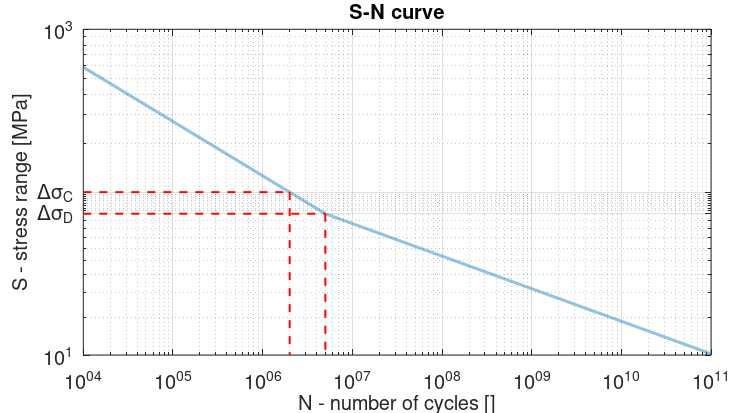
Note: the stress range corresponding to
The stress range corresponding to
$$N=5\cdot10^6$$
cycles is called
constant amplitude fatigue limit and is noted
$$\Delta\sigma_D$$
. By definition,
$$\Delta\sigma_D=0.737\Delta\sigma_C$$
.
The stress range corresponding to
$$N=10^8$$
cycles is called
cut off limit and is noted
$$\Delta\Sigma_L$$
. By definition,
$$\Delta\Sigma_L=0.549\Delta\sigma_D=0.405\Delta\sigma_C$$
3 Third region
This regions corresponds to
$$N>10^8$$
and is defined by a horizontal line such that
$$S=\Delta\sigma_L$$
. This implies that any stress range lower than
$$\Delta\sigma_L$$
will not produce any damage. This region is commonly known as the
endurance limit.
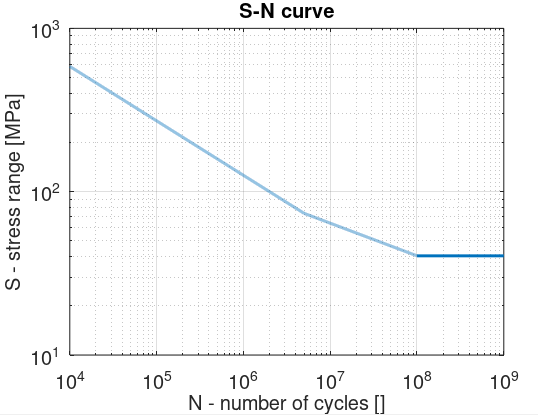
The figure below sums up the S-N curves as defined in the Eurocode:
Note that in practice region 3 is only considered if
no stress range had an amplitude above the cut-off limit. This means that once the simulation is finished, the stress ranges should be checked and if none of them is above the cut-off limit, the fatigue life is considered infinite.
If this is not the case, if one or more of the stress ranges are above the cut-off limit, the fatigue life estimation are computed assuming that there is no region 3 and that
region 2 extends to infinity.
In Ashes, only the latter case is considered. Therefore, the S-N curves will be as shown in the figure below.