TurbSim benchmark
It is possible to use TurbSim files in Ashes. The files can be generated by TurbSim standalone or using the Ashes GUI to TurbSim, available through the
Turbulent Wind Creator.
When TurbSim files are generated, 3 files are produced: an input file (with extension
.inp), a turbulent wind field file (with extension
.wnd) and a summary file (with extension
.sum). The summary file contains statistical information about the wind field. In this benchmark, we compare the data from the summary file to the results produced by Ashes when reading the wind field. This ensures that 1) the wind field from TurbSim is correctly read and interpreted by Ashes and 2) the data is correctly output by Ashes.
1 Test description
Seven different wind fields are generated and used for comparison, in which we vary the wind speed, power law exponent, turbulence intensity and turbulence models. To reproduce the tubrulent wind fields, the input files can be downloaded by clicking on the following links:
2 Model
The model used is a structure with grid points corresponding to the mesh of the turbulent wind field. This enables to avoid interpolating between TurbSim grid points and thus smoothing out some of the statistical characteristics. The figure below shows the model:
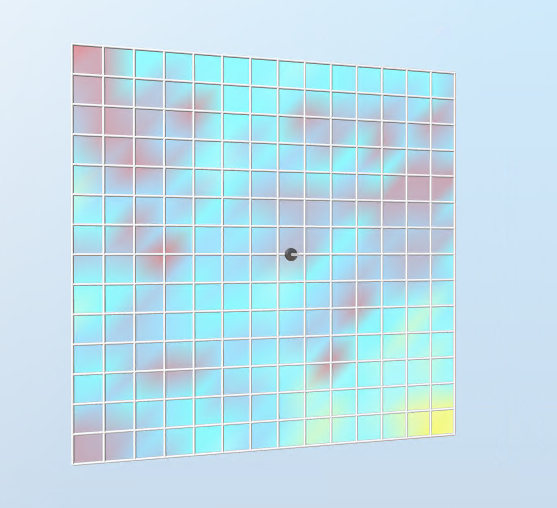
The wind velocity components are extracted at each grid point using the
Fluid kinematics sensor. The simulation is run as
loads only so that the structure does not deform under the influence of the wind.
3 Benchmarked results
The following paragraphs illustrates the different comparisons performed for each wind field.
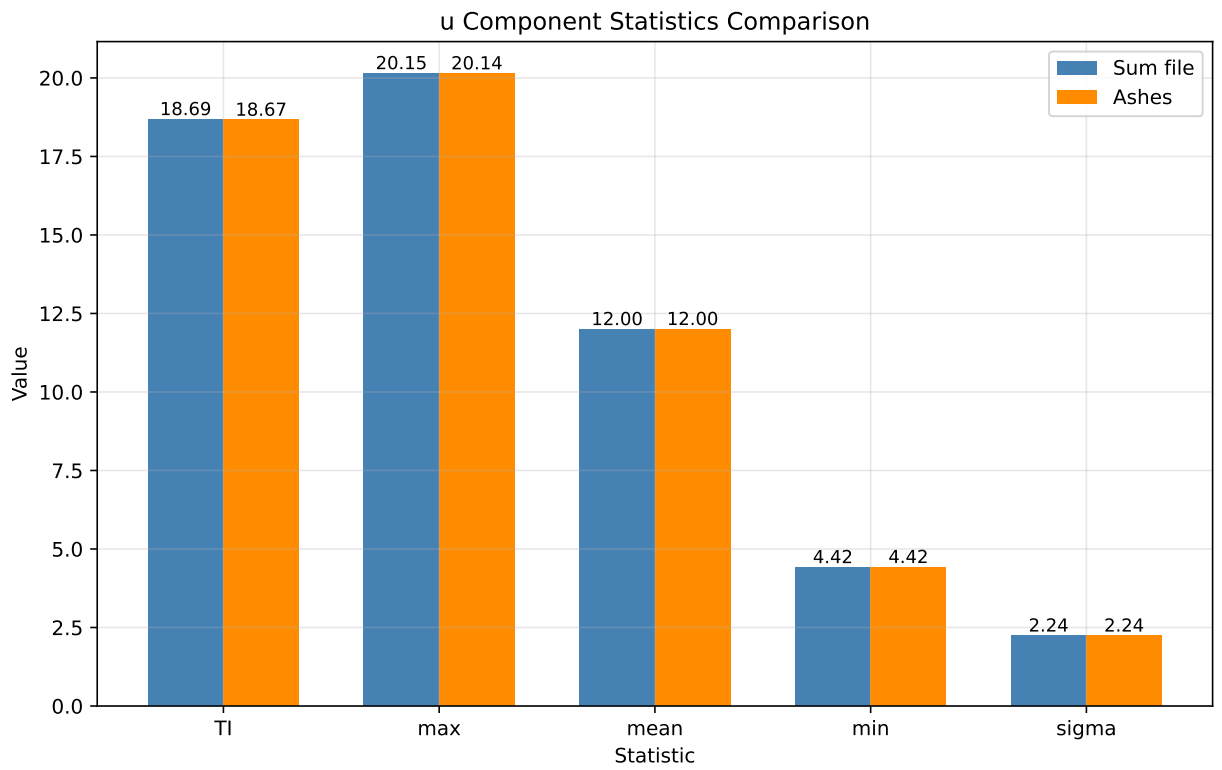
3.1 Statistical info at hub height per component
For each of the three components as well as the total wind and the projection on the horizontal plane, the data corresponding to the first table of the section
Hub-Height Simulated Turbulence Statistical Summary from the summary file is compared to Ashes. This is illustrated in the figure below.
Note that for the v and w component, and since no angle is applied on the TurbSim field, the mean will be 0 and is therefore not plotted.
3.2 Reynolds stress comparison
The data corresponding to the second table of the section
Hub-Height Simulated Turbulence Statistical Summary from the summary file is also compared to Ashes. This is illustrated in the figure below.
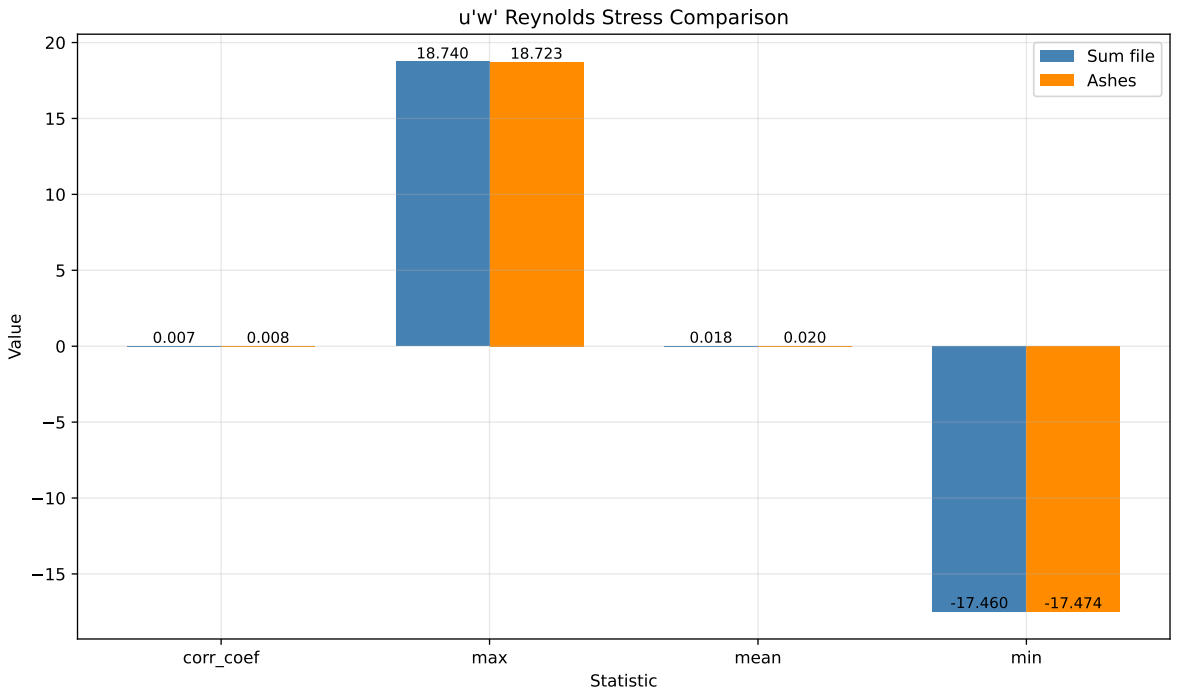
In this table,
$$u'$$
refers to the varying part of the wind component
$$u$$
, such that
$$u = u_{mean}+u'$$
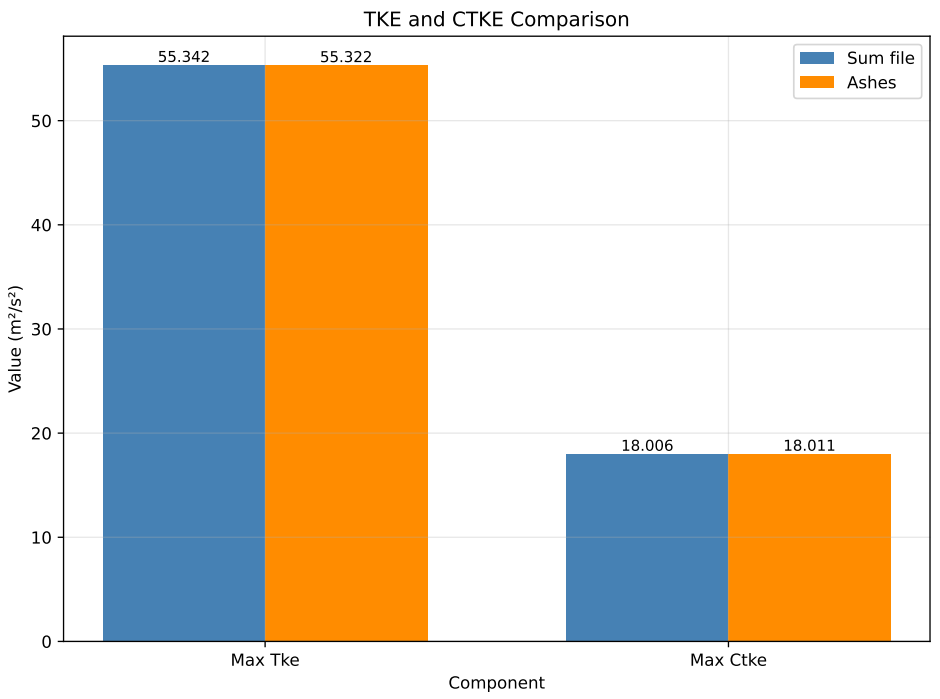
3.3 TKE and CTKE
The last lines of the section
Hub-Height Simulated Turbulence Statistical Summary from the summary file give maximum values for the
Turbulent kinetic energy
(TKE) and the
Coherent Turbulent kinetic energy (CTKE). These are computed as follows:
$$TKE=\frac{1}{2}\left(u'^2+v'^2+w'^2\right)$$
$$CTKE=\frac{1}{2}\sqrt{(u'v')^2+(u'w')^2+(v'w')^2}$$
CTKE is defined in equation 7 of the TurbSim manual.
This comparison is illustrated in the figure below:
Note that the summary file also provides information about
$$U*$$
, but we could not find a general equation in the manual to compute that quantity from the wind time series.3.4 Standard deviation at a given height
The section
Grid Point Variance Summary of the summary file gives the standard deviation of each wind component at each grid point. We compare that standard deviation at three given heights across the width of the field for the U component, as shown in the figure below:
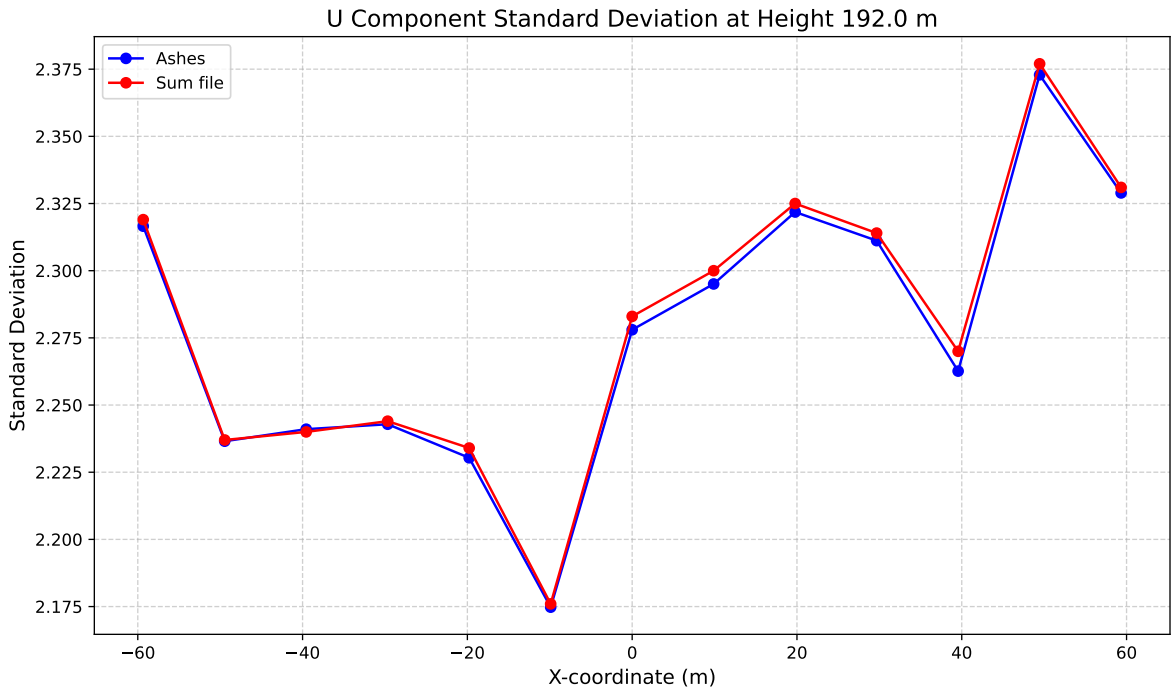
We only show plots for the U component because the V and W components have constant standard deviations across the grid.
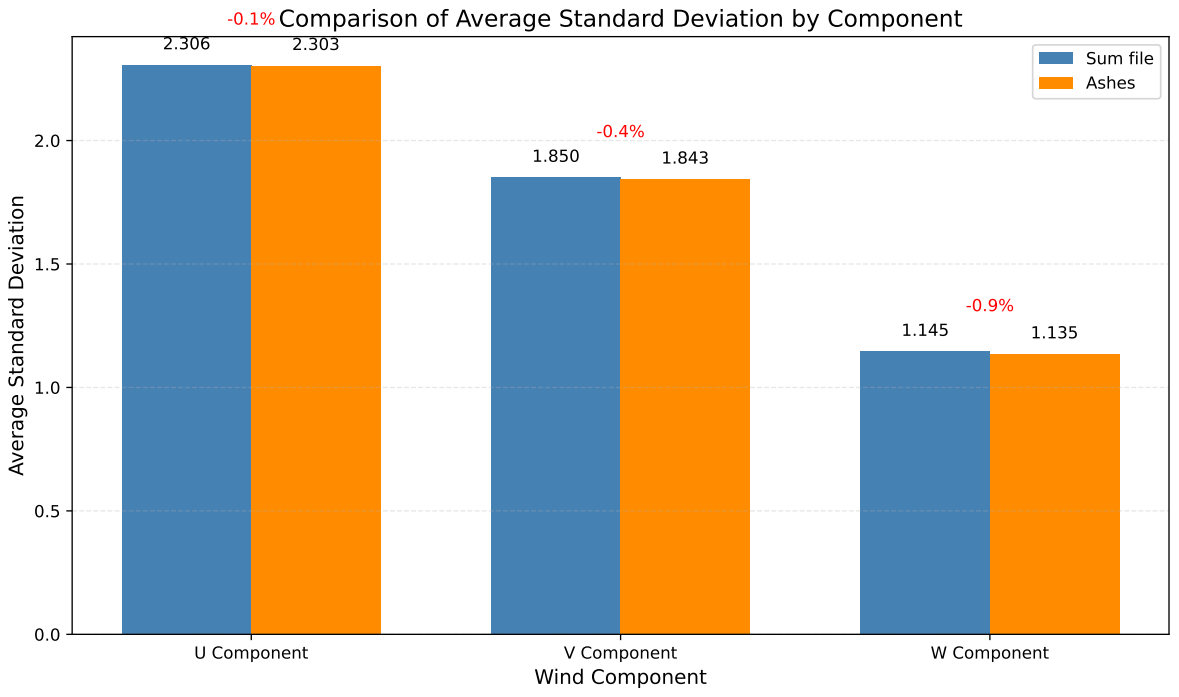
3.5 Standard deviation - average
The standard deviation averaged across the whole grid is also given in the summary file at the end of the
Grid Point Variance Summary section. This is shown in the figure below:
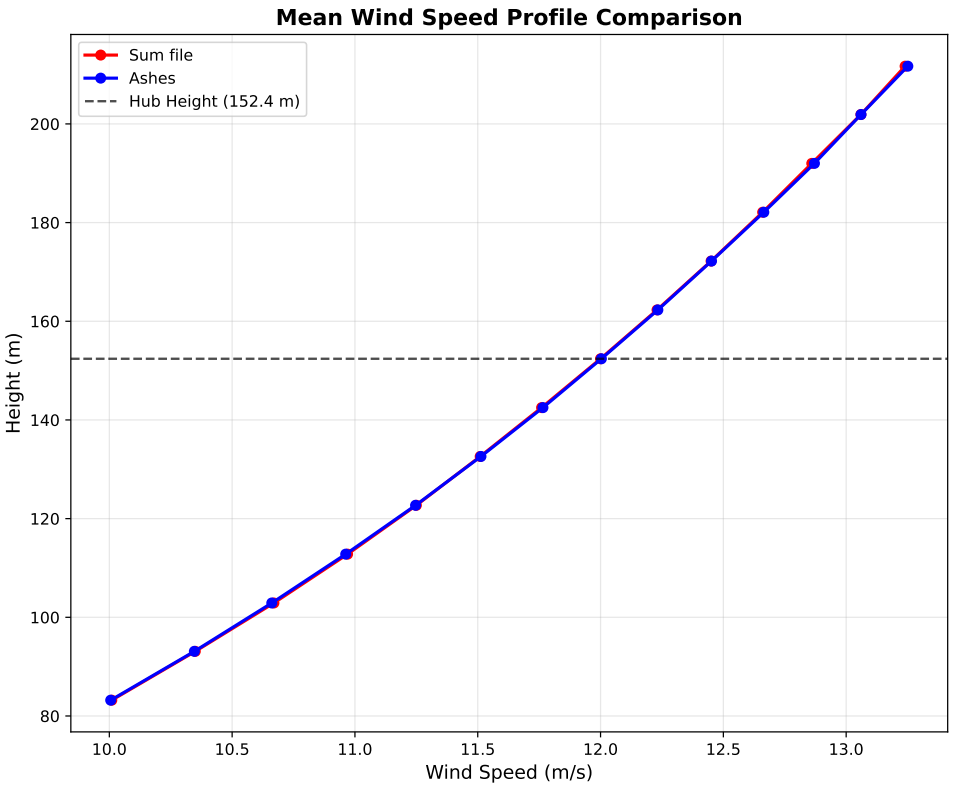
3.6 Wind vertical distribution
The section
Mean Wind Speed Profile
of the summary file gives the vertical distribution of the wind. It is unclear whether this data is computed from the field across the width of the field. For our comparison, we take the points that are at the centre of the grid in the transverse direction and average the speed across the whoe time series. The comparison is illustrated in the figure below:
4 Results
A set of PDF files containing the results can be downloaded from the following links:
These reports were produced at a point in time and the comparison between Ashes and the summary file were checked visually. A regression test is then performed to compare the wind produced by Ashes for the current release to the wind that was produced by Ashes when the check was performed. The resulting report can be downloaded from the following link.
The visual comparison is valid as long as the results from the regression report show no significant changes in the wind output by Ashes.