OpenPile Benchmark
This test ensures that the lateral deflection and internal forces of a monopile under static lateral load produced in Ashes are correct. To do so, we compare results produced by Ashes to those generated by OpenPile, an open-source Python library for pile calculations. The benchmark verifies our implementation of lateral soil resistance using nonlinear p-y curves.
1 Test description
This test uses a monopile driven into the ground and supported laterally by nonlinear springs (p-y curves). A lateral load is applied at the top of the monopile. To check that the structural response is correctly calculated, we compare the following results from Ashes with OpenPile:
- Lateral deflection along the pile depth
- Bending moment distribution along the pile
- Shear force distribution along the pile
The results used to benchmark Ashes are produced as follows:
- The OpenPile data is generated using inputs from the OpenPile GitHub repository examples
- A static nonlinear analysis is run in both Ashes and OpenPile
- The outputs are compared at key locations along the monopile depth
2 Model
The model is illustrated in the figure below.
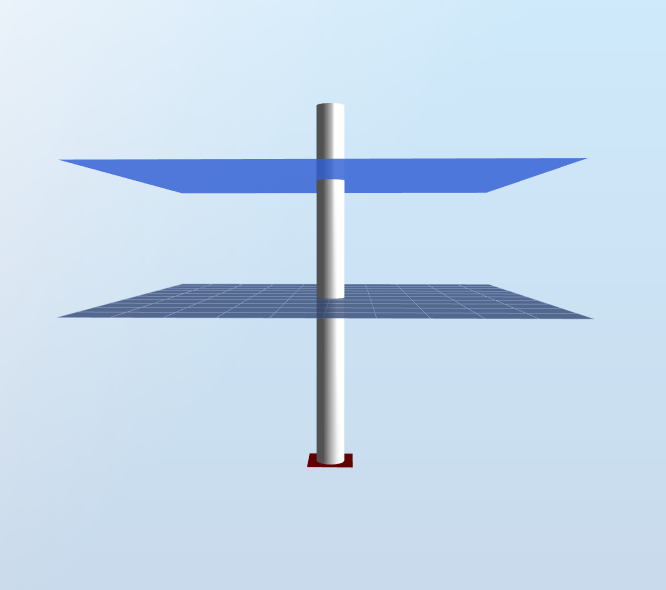
The default model for this test has a monopile with diameter
D = 6.0 m, a total length
$$h=76.5 m$$
and embedded length
L = 35.5 m. The monopile is modeled as a steel
pipe with Young's modulus
E = 210 GPa
and wall thickness
t = 60 mm.
The soil springs are applied at nodes along the pile. The p-y curves
follow the API formulation for sand and clay layers. The curves represent the nonlinear relationship
between soil resistance per unit length of pile (p) and lateral deflection (y).
A load of 10 MN in applied at the top of the monopile.
The simulation is run without gravity, buoyancy aerodynamic or hydrodynamic loads.
3 Benchmarked solution
The data from OpenPile was provided to us by an Ashes user. The figure below shows the shear force and bending moment at different locations along the pile.
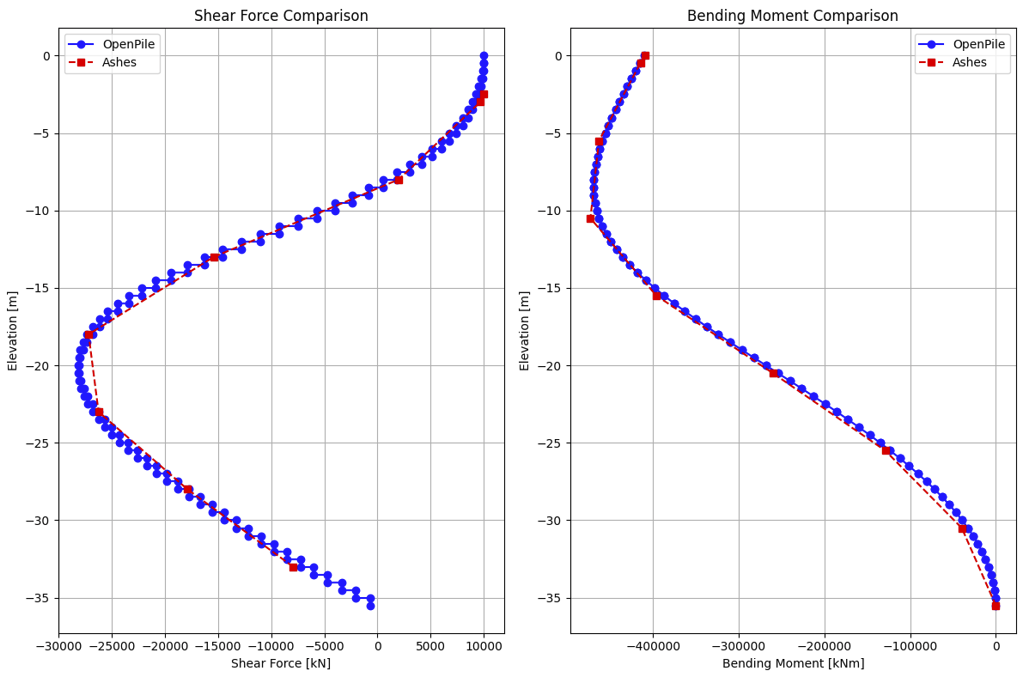
Note: in the shear force plot, it is assumed that the shear force at an element occurs at the middle position of the element. It is necessary to make such an assumption because in a finite element context, a shear force is solved for an element rather than a particular location.
4 Results
A static nonlinear analysis is run for the load case. This results correspond to a regression tests for Ashes, where the results from Ashes are compared to results generated by Ashes when the above plots were produced. If the test passes, the comparison from the graphs is valid.
The test is considered passed if the results are within 0.1% of the base data.
The full report for this test can be found on the following link: