Display settings
In the Display settings you can adjust the way things are displayed in Ashes. Any changes you make here will have no influence on the simulation itself and will therefore not affect the results.
The display settings can be opened by clicking the
 icon in the top ribbon (see
Simulation window). There are four tabs in the display settings, shown below and listed hereafter.
icon in the top ribbon (see
Simulation window). There are four tabs in the display settings, shown below and listed hereafter.
icon in the top ribbon (see
Simulation window). There are four tabs in the display settings, shown below and listed hereafter.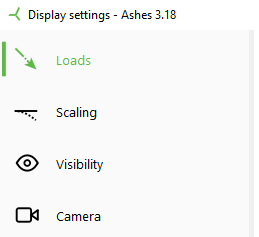
Note: when you have selected your preferences, clicking
Apply will apply the changes to the visualisation, while clicking
OK
will apply the changes and close the Display settings window.
1 Loads
This tab enables you to toggle on and off the visualization of different loads. The loads are represented by vector which color you can define by clicking on the color box
2 Scaling
-
All displacements: scales up or down the visualizaion of the displacements. It has the same function as the
 icon in the top ribbon. This is useful to visualise better the deformations of a model.
 - All supports: scales up or down the supports (springs, fixed or pinned nodes)
- Wave field: increases or decreases the size of the wave field (only applicable to models with sea)
- Grid lines count: a high number of lines makes te visualisation of the waves smoother but more computationally intensive (only applicable to models with sea)
3 Visibility
Different visualization options can be toggled on and off in this tab.
-
Show wind direction line: displays a straight line that follows the wind direction
- Show blade pitch axis: see Pitch axis
- Show pseudo dimensions the structural elements are shown as filled rectangles with the structural properties of the the original element. This can be useful, for example, to visualize how much stiffer a blade is is the edgewise direction compared to the flapwise direction.
-
Show nacelle
housing shows a graphical representation of the nacelle. The size of the nacelle shown here depends on the main shaft lenght.
-
Show hub cover
shows a graphical representation of the hub. The size of the hub shown here depends on the hub radius.
-
Show transition piece
shows a graphical representation of the transition piece, if the option 'Has transition piece' under
tubular tower
has been selected.
-
Show nodes
displays spheres at the location of each node. These are only visible in wireframe mode. The diameter of the spheres depends on the length of the element they are part of.
- Show element axes displays the element axes as vector. The axial axis is represented by a red vector and the 1st and 2nd preincipal axes are represented as green and blue vectors, respectively. For more information check the Coordinate systems section
- Show part coordinate system displays the coordinate system of the individual parts such as the tower or the monopile
4 Display
This tab enables you to change the camera elevation. It has the same function as the
 icon in the top ribbon.
icon in the top ribbon.