Cantilever beam with two simple supports
In this document we compare results produced by Ashes to results published in the structural analysis book by
Bell (1987b).
1 Benchmark
The benchmark in Figure 6.6 from
Bell (1987b) is used for this test, presented in the section below. For this benchmark, the simulation is run using the
Linear and
Nonlinear solvers (see
Time domain simulation) and modelling the beam with
Euler-Bernoulli beam theory or
Timoshenko beam theory. This will produce four sets of results.
In this example, an H-beam with length and supports as shown in the figure below is analysed.
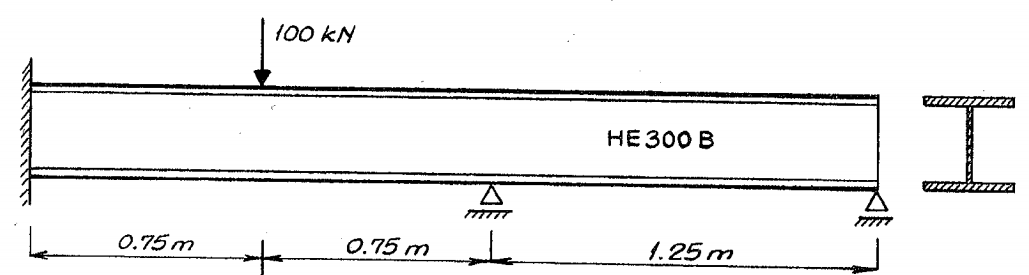
The shear area is given as
$$A_s = 0.029\text{ m}^2$$
and the cross sectional area is
$$A = 0.149\text{ m}^2$$
, which gives a shear correction factor
$$K_s = 29/149=0.195$$
. The beam considered is an HE300B model, with an Elastic modulus
$$E=210\cdot10^9\text{ Pa}$$
and a Poisson ratio
$$\nu = 0.3$$
, which gives a shear modulus
$$G = E/(2(1+\nu))=80.8\cdot10^9\text{ Pa}$$
.
Bell (1987b) provides the displacement at the point of application of the load for two cases:
-
without shear deformation
(modelled with
Euler-Bernoulli beams in Ashes), the displacement is
$$\delta=4.64\cdot10^{-5}\text{ m}$$
-
with shear deformation
(modelled with
Timoshenko beams) is
$$\delta_T = 2.14\cdot10^{-4}\text{ m}$$.
Bell (1987b) also provides the moment diagram for both cases, reproduced below:
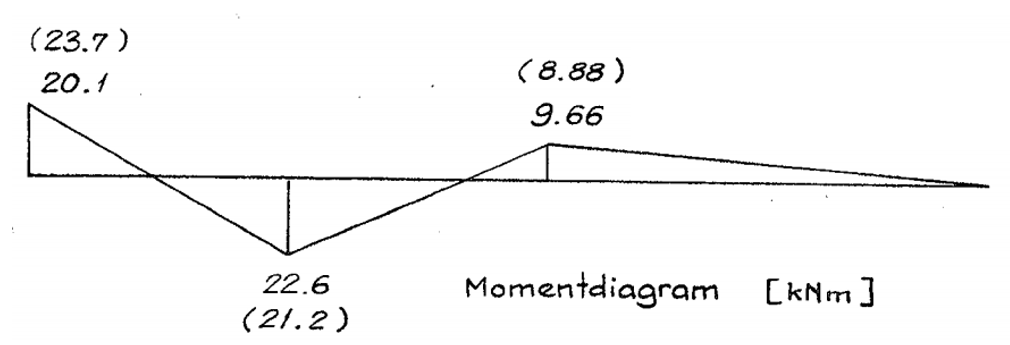
In this figure, the values when considering shear deformation are given without brackets, and the values without shear deformation are in brackets.
The tests are run with the
Linear
and the
Nonlinear
solvers.
The tests are run both with
Rectangular shape
and
Circular shape cross sections. For the circular shape cases, the beam is defined as having the same properties as the rectangular case in the deformation direction.
This produces a total of 8 load cases.
2 Results
The test is considered passed when the last 20% of the Ashes time series lies within 1% of the benchmark value.
The report for this test can be found on the following link:
Note: for the dynamic simulations in Ashes, the loads are ramped-up from 0 to their value in 15 seconds. It is therefore expected that the results from Ashes do not match the benchmark values for the first 15 seconds (See
Loads ramp-up
tab in the
Analysis section.