K-joints fatigue
This document describes a verification test where the results from Ashes are compared to the analytical solution for fatigue in tubular K-joints according to DNV RP-C203.
1 Test Description
We define a K-joint and apply loads to the structure. The stress concentration factors (SCFs) are hardcoded. For each physical K-joint, we define joint sensors: one for the brace side and one for the chord side. This makes it possible to get different stresses on either side. For each joint sensor, we define 4 SCFs:
- SCF_AS: Axial stress concentration factor at saddle
- SCF_AC: Axial stress concentration factor at crown
- SCF_MIP: In-plane bending stress concentration factor
- SCF_MOP: Out-of-plane bending stress concentration factor
We then apply a load and compute the stress around 8 points based on DNV RP-C203. The fatigue damage is then computed using the rainflow counting method and the appropriate SN-curve.
Note: a positive stress means tension, and a negative stress means compression
2 Analytical Solution
Stresses at the 8 circumferential points of each sensor are computed following the description in the Fatigue document.
The fatigue and damage for each point is computed directly from the stress ranges according to the workflow described in the Fatigure analysis procedure
3 Model Description
The K-joint is extracted from the truss tower of the OC4 Phase II project. It is defined with the following nodes:
| Node | X (m) | Y (m) | Z (m) |
|---|---|---|---|
| 16 | 5.836 | -5.836 | -39.980 |
| 20 | 5.333 | -5.333 | -24.614 |
| 33 | 4.820 | -4.820 | -8.922 |
| 41 | 5.620 | 0.000 | -33.373 |
| 45 | 5.064 | 0.000 | -16.371 |
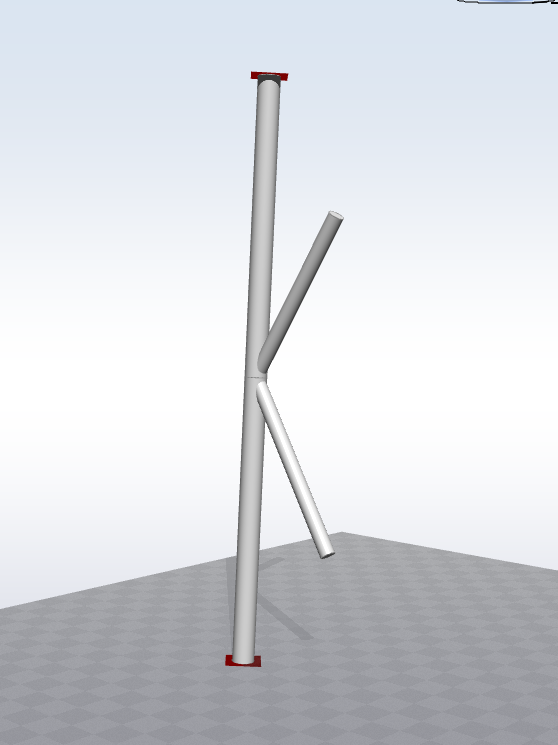
Nodes 16 and 33 are fixed (constrained in all degrees of freedom). Node 20 is the K-joint intersection node, where the two brace members (elements 42 and 59) connect to the chord members (elements 16 and 29).
Three circular hollow cross sections are defined:
| Name | Diameter (m) | Thickness (m) |
|---|---|---|
| BracesMG | 0.8 | 0.02 |
| LegLowMG | 1.2 | 0.05 |
| LegHighMG | 1.2 | 0.035 |
The members are defined as follows:
| Member | Start Node | End Node | Cross Section | Role |
|---|---|---|---|---|
| 16 | 16 | 20 | LegLowMG | Chord (lower) |
| 29 | 20 | 33 | LegHighMG | Chord (upper) |
| 42 | 20 | 41 | BracesMG | Brace 1 |
| 59 | 20 | 45 | BracesMG | Brace 2 |
For the brace cross section (BracesMG), the cross-sectional area and second moment of area are derived as follows. For a circular hollow section with outer diameter
$$D = 0.8$$
m and thickness $$t = 0.02$$
m, the inner diameter is:
$$d = D - 2t = 0.8 - 2 \times 0.02 = 0.76 \text{ m}$$
The cross-sectional area is:
$$A = \frac{\pi}{4}\left(D^2 - d^2\right) = \frac{\pi}{4}\left(0.8^2 - 0.76^2\right) \approx 0.04901 \text{ m}^2$$
The second moment of area is:
$$I = \frac{\pi}{64}\left(D^4 - d^4\right) = \frac{\pi}{64}\left(0.8^4 - 0.76^4\right) \approx 3.730 \times 10^{-3} \text{ m}^4$$
Four fatigue sensors are defined — two for each brace member, corresponding to the brace side and the chord side of the joint. All sensors use the EurocodeEN1993 SN collection, the SN80 SN-curve, and a stress filter of 0.1. The joints and their hardcoded SCFs are:
| Joint Name | Beam Element | Side | SCF_AS | SCF_AC | SCF_MIP | SCF_MOP |
|---|---|---|---|---|---|---|
| J1_brace | 42 | Brace side | 3.98784 | 2.55298 | 1.64091 | 1.70045 |
| J1_chord | 42 | Chord side | 3.95323 | 3.32434 | 1.13201 | 1.69525 |
| J2_brace | 59 | Brace side | 3.98784 | 2.39751 | 1.68534 | 1.54302 |
| J2_chord | 59 | Chord side | 3.82304 | 3.05063 | 1.08490 | 1.53831 |
The model is shown in the figure below:
4 Expected Results
4.1 Tests 1 to 12
In Tests 1 to 12, a single constant load (force or moment) is applied to one of the free brace end nodes (node 41 for tests 1–3 and 7–9, node 45 for tests 4–6 and 10–12). No fatigue damage is computed in these tests; instead, the element stresses (axial, in-plane bending, and out-of-plane bending) and the resulting circumferential hot-spot stresses at the 8 DNV positions are verified analytically.
The applied loads are summarised in the table below.
| Test | Node | Load type | Direction | Magnitude |
|---|---|---|---|---|
| 1 | 41 | Force | X | 20 000 N |
| 2 | 41 | Force | Z | −80 000 N |
| 3 | 41 | Force | Y | 20 000 N |
| 4 | 45 | Force | Y | 20 000 N |
| 5 | 45 | Force | X | 20 000 N |
| 6 | 45 | Force | Z | −80 000 N |
| 7 | 41 | Moment | X | 200 000 N·m |
| 8 | 41 | Moment | Z | −800 000 N·m |
| 9 | 41 | Moment | Y | 200 000 N·m |
| 10 | 45 | Moment | Y | 200 000 N·m |
| 11 | 45 | Moment | X | 200 000 N·m |
| 12 | 45 | Moment | Z | −800 000 N·m |
The expected results for each load case are presented in the two tables below. For tests where an element carries zero load, all internal forces and circumferential stresses for that element are 0. Stress values are in MPa; forces in kN; moments in kN·m.
4.1.1 Internal Forces and Maximum Normal Stress
The table below gives the internal forces at the joint end of the active brace element and the maximum normal stress magnitude for each load case.
| Test | Element | Axial force (kN) | Shear 1st axis (kN) | Shear 2nd axis (kN) | Torque (kN·m) | Moment 1st axis at i (kN·m) | Moment 2nd axis at i (kN·m) | Max normal stress (MPa) |
|---|---|---|---|---|---|---|---|---|
| 1 | 42 | 0.56 | −0.92 | −19.97 | 0.0 | −204.88 | 9.41 | 22.01 |
| 2 | 42 | 68.30 | 41.65 | 0.0 | 0.0 | 0.0 | −427.26 | 47.22 |
| 3 | 42 | 10.40 | −17.05 | 1.07 | 0.0 | 11.03 | 174.93 | 19.01 |
| 4 | 59 | 10.86 | 16.76 | −1.01 | 0.0 | −9.90 | −164.65 | 17.91 |
| 5 | 59 | −0.55 | −0.85 | −19.97 | 0.0 | −196.18 | 8.31 | 21.07 |
| 6 | 59 | −67.14 | 43.49 | 0.0 | 0.0 | 0.0 | −427.18 | 47.19 |
| 7 | 42 | 0.0 | 0.0 | 0.0 | 5.60 | 9.18 | 199.71 | 21.44 |
| 8 | 42 | 0.0 | 0.0 | 0.0 | 683.04 | −416.48 | 0.0 | 44.67 |
| 9 | 42 | 0.0 | 0.0 | 0.0 | 103.97 | 170.51 | −10.75 | 18.32 |
| 10 | 59 | 0.0 | 0.0 | 0.0 | 108.60 | −167.64 | 10.07 | 18.01 |
| 11 | 59 | 0.0 | 0.0 | 0.0 | −5.48 | 8.46 | 199.75 | 21.44 |
| 12 | 59 | 0.0 | 0.0 | 0.0 | −671.43 | −434.95 | 0.0 | 46.65 |
4.1.2 Circumferential Hot-Spot Stresses
The table below gives the circumferential hot-spot stresses (MPa) at the 8 DNV positions for both the brace side and chord side sensors, for each load case. Tests where an element carries zero load have all stresses equal to 0 and are omitted from the table.
| Test | Element | Side | 0° | 45° | 90° | 135° | 180° | 225° | 270° | 315° |
|---|---|---|---|---|---|---|---|---|---|---|
| 1 | 42 | Brace side | −0.56 | −26.84 | −37.37 | −25.98 | 0.66 | 26.91 | 37.43 | 26.05 |
| Chord side | −0.38 | −26.62 | −37.25 | −26.02 | 0.47 | 26.70 | 37.32 | 26.11 | ||
| 2 | 42 | Brace side | −69.49 | −45.05 | 8.45 | 61.08 | 80.60 | 54.16 | −1.33 | −51.97 |
| Chord side | −46.26 | −28.09 | 9.51 | 45.13 | 57.28 | 38.23 | −0.24 | −34.98 | ||
| 3 | 42 | Brace side | 31.69 | 22.51 | 0.55 | −21.12 | −30.00 | −21.12 | 0.54 | 22.50 |
| Chord side | 22.12 | 15.82 | 0.71 | −14.27 | −20.44 | −14.28 | 0.70 | 15.82 | ||
| 4 | 59 | Brace side | −28.93 | −20.37 | 0.53 | 21.79 | 30.70 | 21.79 | 0.53 | −20.38 |
| Chord side | −18.35 | −12.81 | 0.68 | 14.34 | 20.04 | 14.33 | 0.67 | −12.81 | ||
| 5 | 59 | Brace side | −0.68 | −23.46 | −32.52 | −22.56 | 0.59 | 23.39 | 32.46 | 22.49 |
| Chord side | −0.45 | −23.23 | −32.42 | −22.65 | 0.36 | 23.15 | 32.36 | 22.58 | ||
| 6 | 59 | Brace side | −82.54 | −55.87 | 0.97 | 53.13 | 71.61 | 47.12 | −7.53 | −61.88 |
| Chord side | −54.85 | −36.80 | 0.06 | 33.37 | 44.38 | 27.38 | −8.42 | −42.79 | ||
| 7 | 42 | Brace side | 35.18 | 24.44 | −0.62 | −25.31 | −35.18 | −24.44 | 0.62 | 25.31 |
| Chord side | 24.27 | 16.73 | −0.61 | −17.60 | −24.27 | −16.73 | 0.61 | 17.59 | ||
| 8 | 42 | Brace side | −4.60 | −56.86 | −75.81 | −50.35 | 4.60 | 56.86 | 75.81 | 50.35 |
| Chord side | −3.17 | −55.68 | −75.57 | −51.19 | 3.17 | 55.68 | 75.57 | 51.19 | ||
| 9 | 42 | Brace side | 0.0 | 22.03 | 31.16 | 22.04 | 0.0 | −22.03 | −31.16 | −22.04 |
| Chord side | 0.0 | 21.96 | 31.06 | 21.97 | 0.0 | −21.96 | −31.06 | −21.97 | ||
| 10 | 59 | Brace side | 0.0 | −19.66 | −27.79 | −19.65 | 0.0 | 19.66 | 27.79 | 19.65 |
| Chord side | 0.0 | −19.59 | −27.71 | −19.59 | 0.0 | 19.59 | 27.71 | 19.59 | ||
| 11 | 59 | Brace side | 36.13 | 25.13 | −0.59 | −25.97 | −36.13 | −25.13 | 0.59 | 25.97 |
| Chord side | 23.26 | 16.03 | −0.59 | −16.86 | −23.26 | −16.03 | 0.59 | 16.86 | ||
| 12 | 59 | Brace side | −4.73 | −54.15 | −71.85 | −47.46 | 4.73 | 54.15 | 71.85 | 47.46 |
| Chord side | −3.04 | −52.80 | −71.63 | −48.50 | 3.04 | 52.80 | 71.63 | 48.50 |
4.2 Tests 13 and 14
In Tests 13 and 14, a load time history in all 6 degrees of freedom is applied simultaneously at both free brace end nodes (node 41 and node 45). The load history was extracted from a simulation with turbulent wind and irregular waves with the OC4 model, producing a realistic dynamic loading scenario. As in the previous tests, the circumferential hot-spot stresses are computed at the 8 DNV positions for both the brace side and chord side of each joint. However, because the loading is dynamic rather than static, it is no longer meaningful to report a single stress value per location. Instead, rainflow counting is applied to the stress time histories at each of the 8 circumferential points, and the resulting fatigue damage and fatigue life are reported.
The two tests differ only in the SN-curve used for the fatigue calculation:
- Test 13: SN80 curve (EurocodeEN1993 collection)
- Test 14: SN100 curve (EurocodeEN1993 collection)
The fatigue damage values reported below are dimensionless accumulated damage values (Palmgren–Miner rule), and the fatigue life is expressed in years.
4.2.1 Test 13 — SN80 Curve
The expected fatigue damage and fatigue life at the 8 circumferential positions for element 42 (brace 1) are given below.
| Element | Side | Quantity | 0° | 45° | 90° | 135° | 180° | 225° | 270° | 315° |
|---|---|---|---|---|---|---|---|---|---|---|
| 42 | Brace side | Damage (−) | 1.77e−05 | 1.06e−05 | 3.05e−06 | 3.89e−06 | 7.20e−06 | 3.46e−06 | 1.37e−06 | 6.65e−06 |
| Fatigue life (yr) | 1.18 | 1.97 | 6.85 | 5.38 | 2.90 | 6.05 | 15.24 | 3.15 | ||
| Chord side | Damage (−) | 1.43e−05 | 1.21e−05 | 7.36e−06 | 6.63e−06 | 7.38e−06 | 5.35e−06 | 4.26e−06 | 8.31e−06 | |
| Fatigue life (yr) | 1.46 | 1.72 | 2.84 | 3.16 | 2.83 | 3.91 | 4.92 | 2.52 |
The expected fatigue damage and fatigue life at the 8 circumferential positions for element 59 (brace 2) are given below.
| Element | Side | Quantity | 0° | 45° | 90° | 135° | 180° | 225° | 270° | 315° |
|---|---|---|---|---|---|---|---|---|---|---|
| 59 | Brace side | Damage (−) | 5.39e−06 | 1.93e−06 | 4.11e−07 | 1.39e−06 | 3.68e−06 | 1.62e−06 | 6.07e−07 | 2.36e−06 |
| Fatigue life (yr) | 3.88 | 10.83 | 50.89 | 15.07 | 5.68 | 12.94 | 34.44 | 8.86 | ||
| Chord side | Damage (−) | 4.21e−06 | 2.46e−06 | 1.29e−06 | 2.02e−06 | 3.26e−06 | 2.34e−06 | 1.67e−06 | 2.90e−06 | |
| Fatigue life (yr) | 4.97 | 8.50 | 16.26 | 10.36 | 6.42 | 8.95 | 12.50 | 7.22 |
4.2.2 Test 14 — SN100 Curve
The expected fatigue damage and fatigue life at the 8 circumferential positions for element 42 (brace 1) are given below.
| Element | Side | Quantity | 0° | 45° | 90° | 135° | 180° | 225° | 270° | 315° |
|---|---|---|---|---|---|---|---|---|---|---|
| 42 | Brace side | Damage (−) | 8.23e−06 | 4.66e−06 | 1.20e−06 | 1.54e−06 | 3.02e−06 | 1.36e−06 | 4.86e−07 | 2.74e−06 |
| Fatigue life (yr) | 2.54 | 4.49 | 17.49 | 13.58 | 6.93 | 15.40 | 43.01 | 7.62 | ||
| Chord side | Damage (−) | 6.49e−06 | 5.42e−06 | 3.10e−06 | 2.75e−06 | 3.09e−06 | 2.14e−06 | 1.65e−06 | 3.52e−06 | |
| Fatigue life (yr) | 3.22 | 3.86 | 6.75 | 7.60 | 6.77 | 9.76 | 12.65 | 5.94 |
The expected fatigue damage and fatigue life at the 8 circumferential positions for element 59 (brace 2) are given below.
| Element | Side | Quantity | 0° | 45° | 90° | 135° | 180° | 225° | 270° | 315° |
|---|---|---|---|---|---|---|---|---|---|---|
| 59 | Brace side | Damage (−) | 2.15e−06 | 7.25e−07 | 1.35e−07 | 5.05e−07 | 1.44e−06 | 6.04e−07 | 1.99e−07 | 9.00e−07 |
| Fatigue life (yr) | 9.72 | 28.86 | 155.30 | 41.38 | 14.48 | 34.60 | 105.00 | 23.23 | ||
| Chord side | Damage (−) | 1.66e−06 | 9.41e−07 | 4.62e−07 | 7.65e−07 | 1.27e−06 | 8.95e−07 | 6.24e−07 | 1.12e−06 | |
| Fatigue life (yr) | 12.61 | 22.23 | 45.26 | 27.34 | 16.44 | 23.36 | 33.52 | 18.63 |
5 Report
A time simulation of 660 seconds is run for each load case and the last 20% are compared to the analytical solution. If the results from Ashes are within 3% of the analytical solution, the test is considered passed, with one notable exception explained in the box below.
The report of this test can be found on the following link:
Note: for load case 6 (downwards vertical force on the upper brace), the configuration is such that the normal stress and the out-of-plane bending stress produce almost identical contributions on the chord side at point 90 but with opposite signs. This implies that even though the internal stresses are within .1% of the analytical solution, the resulting circumferential stress in Ashes is about 6% larger. For this case only, the threshold for passing the test is set to 7%.