Fatigue sensor stresses
1 Test description
This test verifies that the normal stresses reported by Ashes'
fatigue sensors are correct. The fatigue sensor used here is a
beam end fatigue sensor. A fatigue sensor evaluates the normal stress at 8 points spaced 45° apart around a circular cross section (pt0, pt45, pt90, pt135, pt180, pt225, pt270 and pt315). The stress at each point is the superposition of the axial stress caused by the self-weight of the structure and the bending stress caused by a horizontal force applied at the top of the tower.
The test isolates and then combines these two contributions. Aerodynamic loads are disabled (the wind speed is set to zero) so that the only loads acting on the structure are gravity and the applied point force. The following load cases are tested:
- Load case 1: gravity only (self-weight, no applied force).
- Load case 2: applied top force only (gravity disabled).
- Load case 3: gravity and applied top force combined.
Each of these three load cases is run twice, once with a
linear analysis and once with a
nonlinear analysis (suffixed “- linear” and “- nonlinear”). Because the deflections are small and the response settles to a static equilibrium, the nonlinear results are expected to match the linear ones, so the same analytical values apply to both.
2 Model
The figure below shows the model:
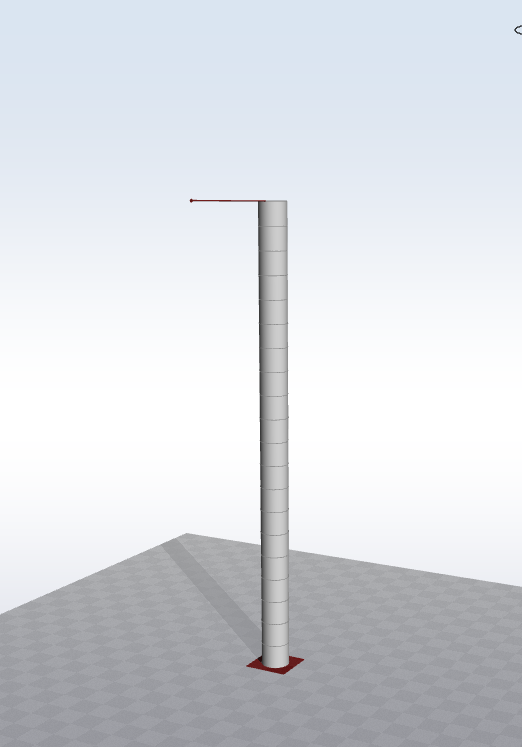
The model is a single constant (cylindrical) circular hollow tubular tower, clamped at its base. Its height is
$$L=100\text{ m}$$
The cross section has a constant outer radius
$$R=3\text{ m}$$
(outer diameter 6 m) and a wall thickness
$$t=0.035\text{ m}$$
. The material is steel. This gives a structural (cross-sectional) area
$$A_s=\pi\left(R^2-(R-t)^2\right)=0.656\text{ m}^2$$
and a second moment of area
$$I=\frac{\pi}{4}\left(R^4-(R-t)^4\right)=2.917\text{ m}^4$$
The tower is meshed into 20 beam elements of 5 m each, i.e. 21 nodes. The base is node 1 and the top of the defined section is the RNA node, named RNA_node. Each load case is run with both a
linear and a
nonlinear analysis.
The test is run in two variants that share the same model, loads and analytical solution:
- a dynamic variant (test “Fatigue sensor stresses”), a time-domain simulation whose response settles to the static equilibrium; and
- a static variant (test “Fatigue sensor stresses static”), which solves directly for the equilibrium state with the analysis type set to Static (duration 0 s).
Because both variants reach the same static equilibrium, the analytical stresses derived below apply unchanged to each of them.
All stress concentration factors (SCFs) of the fatigue sensor are set to 1.
In the dynamic variant, because the loads are applied as a step at the start of the simulation, the structure would oscillate about its static equilibrium if it were undamped. To let the response settle to its static value,
stiffness-proportional structural damping with a damping ratio of 5% is applied at a period of 3 s. The static variant solves for the equilibrium directly, so damping plays no role there.
The loads differ between load cases as follows:
- Load case 1: gravity enabled, no applied force.
- Load case 2: gravity disabled, a horizontal point force of 10 kN in the global x-direction applied at the top node (RNA_node).
- Load case 3: gravity enabled and the 10 kN horizontal force applied.
The 10 kN force acting 100 m above the base produces a bending moment of 1000 kNm at the sensor location.
3 Analytical solution
The page
Stresses and responses describes how Ashes computes the axial and bending stresses.
The normal stress at each fatigue point is the superposition of the axial stress from self-weight and the bending stress from the applied force. The sensor is located at the base of the tower (element 1, station i), where both the axial force and the bending moment are largest.
3.1 Load case 1 – gravity only
Under self-weight, the axial force at the base is the supported weight
$$W_t$$
, defined as the total weight of the tower minus half of the base element:
$$W_t=4922.93\text{ kN}$$
The resulting axial stress is uniform over the cross section and compressive (negative):
$$\sigma_\text{axial}=-\frac{W_t}{A_s}=-\frac{4922.93\cdot10^3}{0.656}=-7.504\text{ MPa}$$
Every one of the 8 fatigue points therefore reads
$$-7.504\text{ MPa}$$
.3.2 Load case 2 – applied top force only
With gravity disabled, only the bending stress from the horizontal force remains. The bending moment at the base is
$$M=F\cdot L=10\text{ kN}\cdot100\text{ m}=1000\text{ kNm}$$
The page
Fatigue shows how the stresses at the different hotspots are computed depending on the stress concentration factors (SCFs).
Around the section the bending stress varies as
$$\sigma(\theta)=-\sigma_\text{bend}\cos(\theta)$$
, where
$$\theta$$
is the angular position of the point. This is compressive at pt0, tensile at pt180, zero at pt90 and pt270, and
$$\pm\sigma_\text{bend}\frac{\sqrt{2}}{2}=\pm0.72\text{ MPa}$$
on the 45° diagonals:- pt0 = −1.03 MPa, pt180 = +1.03 MPa
- pt90 = pt270 = 0
- pt45 = pt315 = −0.72 MPa
- pt135 = pt225 = +0.72 MPa
3.3 Load case 3 – combined
With both gravity and the applied force, the stress at each point is the sum of the axial and bending contributions,
$$\sigma(\theta)=\sigma_\text{axial}-\sigma_\text{bend}\cos(\theta)$$
:- pt90 = pt270 = −7.504 MPa (axial contribution only)
- pt180 = −6.47 MPa (axial compression relieved by bending tension)
- pt0 = −8.534 MPa (axial and bending both compressive)
- pt45 = pt315 = −8.22 MPa
- pt135 = pt225 = −6.77 MPa
The table below summarises the expected normal stress (in MPa) at every fatigue point for the three load cases:
| Point | LC1 (gravity) | LC2 (force) | LC3 (combined) |
|---|---|---|---|
| pt0 | −7.504 | −1.03 | −8.534 |
| pt45 | −7.504 | −0.72 | −8.22 |
| pt90 | −7.504 | 0 | −7.504 |
| pt135 | −7.504 | +0.72 | −6.77 |
| pt180 | −7.504 | +1.03 | −6.47 |
| pt225 | −7.504 | +0.72 | −6.77 |
| pt270 | −7.504 | 0 | −7.504 |
| pt315 | −7.504 | −0.72 | −8.22 |
4 Results
A single fatigue sensor is placed at the base of the tower (element 1, station i), named
Sensor Fatigue [Element 1 Tubular tower] i. For each load case, the 8 normal-stress fatigue points reported by Ashes (Normal stress pt0, pt45, pt90, pt135, pt180, pt225, pt270 and pt315) are compared against the analytical values above.
In the dynamic variant the comparison is made over the last fifth of the time series (by which point the response has settled to its static value); in the static variant the single equilibrium value is compared directly. Both are checked for the linear and the nonlinear analysis of each load case. The test passes if each compared value is within 1% of the analytical solution.
The report for this test can be found on the following link: