Campbell diagram verification
1 Test description
In essence, this is a decay test on a
rotating wind turbine. A 10 kN out-of-plane force is applied at the tip of blade 1, held while the rotor is brought to a steady speed, and then released instantly; what follows is a free decay, in which the turbine rings itself out at its own natural frequencies while it keeps rotating. That is repeated once per rotor speed, from 0 to 14 rpm in steps of 1 rpm, with the rotor held at speed by the generator controller. The frequencies the turbine rings at are exactly what a Campbell diagram plots, so those are what the test compares: each frequency measured in the decay must be within 2% of the corresponding line of the Campbell diagram Ashes computes for the same rotor speed.
The point of the test is therefore to confront two entirely different routes to the same numbers: the Campbell diagram, which Ashes obtains from an eigenvalue analysis of the rotating turbine, and a nonlinear time-domain simulation, which knows nothing about eigenvalues and simply lets the structure vibrate. Fifteen load cases (0 to 14 rpm) cover the sweep.
Two quantities are recorded during each decay: the y displacement of the hub node, and the out-of-plane deflection of the tip of blade 1. The hub signal alone is enough to obtain the frequencies - every line the Campbell diagram plots can be read off the spectrum of the hub node - and a simpler test could stop there, checking that the frequencies measured at the hub match the lines of the diagram. What the blade tip signal adds is
which line is which: it is what separates the three flapwise lines from each other into backward whirl, collective and forward whirl (the mechanism is described below). Without it, the test could only say that the
set of measured frequencies matches the
set of lines in the diagram - a check that would pass just as happily on a diagram whose whirl lines had been swapped, since swapping them leaves the frequencies untouched and moves only the labels. Those labels are the reason a Campbell diagram is drawn in the fixed frame in the first place, so they are worth verifying, and verifying them costs one extra sensor.
Why the frame matters. A rotating blade mode does not, in general, show up at the same frequency in the rotating (blade) frame and in the fixed (ground) frame: a cyclic, whirling mode splits into a backward-whirl and a forward-whirl line 1P apart from the rotating-frame frequency, where 1P is the rotor speed expressed in Hz. Ashes' Campbell diagram is written in the fixed frame, so this test drives the rotor at a fixed speed, releases a tip load to start a free decay, and identifies the resulting fixed-frame lines from the decay spectrum before comparing them against the diagram.
Only the first flapwise cluster of modes (support/tower mode, flap backward whirl, flap collective and flap forward whirl) is checked; an edgewise variant of this test would need its own frequency band.
2 Model
The model is the onshore NREL 5-MW-class reference wind turbine, made purely structural for this test: aerodynamic loads are removed by setting the air density (
$$\text{Wind.Density}=0$$
) to zero, and gravity is disabled. The solver uses a fixed, user-defined timestep of
$$\Delta t=0.025\text{ s}$$
.
A PID-controlled generator holds the rotor at a fixed speed for the whole 500 s simulation: the setpoint is a
generator speed, related to the rotor speed through the gearbox ratio
$$N_{gb}=97$$
, i.e.
$$\Omega_{gen}=N_{gb}\cdot\Omega_{rotor}$$
. Each of the 15 load cases also sets its own rotor speed as an initial condition, from 0 to 14 rpm, so the rotor starts at its target speed and the controller does not have to spin it up or down before the free decay is recorded.
A
$$F=10\text{ kN}$$
out-of-plane (global y) force is applied at the tip of blade 1 (node id 81) and held until
$$t_{release}=300\text{ s}$$
, at which point it is released instantly. The remaining 200 s of the 500 s simulation is thus a free decay of the first flapwise mode of that blade, recorded once per rotor speed.
Two sensors are used per load case:
- blade 1 tip out-of-plane deflection, measured in the rotating frame,
- hub node y displacement, measured in the fixed (ground) frame.
Ashes' own Campbell diagram is generated by a second batch, on the same turbine with Campbell diagram generation enabled, sweeping the rotor speed from 0 to 15 rpm in steps of 1 rpm, and writes one column per mode line to a CampbellDiagram.csv file. Each column is tagged BW or FW for the two members of a cyclic blade pair, or left untagged for axisymmetric modes (support structure and collective rotor modes). The diagram must declare itself to be in the fixed (ground) frame for the comparison below to be meaningful; if it is not (e.g. an older ashes-cli build without BW/FW mode classification), the test fails outright rather than compare frequencies that live in different frames.
3 Analytical solution
The relationship between the rotating and fixed frames follows directly from the rotor symmetry:
-
a
cyclic (whirling) blade mode at rotating-frame frequency
$$f_{rot}$$appears in the fixed frame as two lines, one 1P below and one 1P above it: a backward whirl (BW) line and a forward whirl (FW) line,
- a collective mode (all blades moving in phase) is axisymmetric and appears at the same frequency in both frames.
With
$$1P=\Omega_{rotor}/60\text{ [Hz]}$$
, the fixed-frame frequencies of the first flapwise cluster are thus
$$f_{BW}=f_{rot}-1P,\quad f_{collective}=f_{rot},\quad f_{FW}=f_{rot}+1P$$
Equivalently, from the fixed-frame side, the rotating-frame partner of a fixed-frame line of frequency
$$f_{fixed}$$
is expected at
$$f_{fixed}+1P$$
if the line is BW, at
$$f_{fixed}$$
(unshifted) if it is collective, and at
$$f_{fixed}-1P$$
if it is FW. All three sidebands leak into the rotating spectrum at some level, so the test identifies the kind of a fixed-frame peak by which of these three rotating-frame candidates carries the largest amplitude, requiring a match within 0.7% of the target frequency.
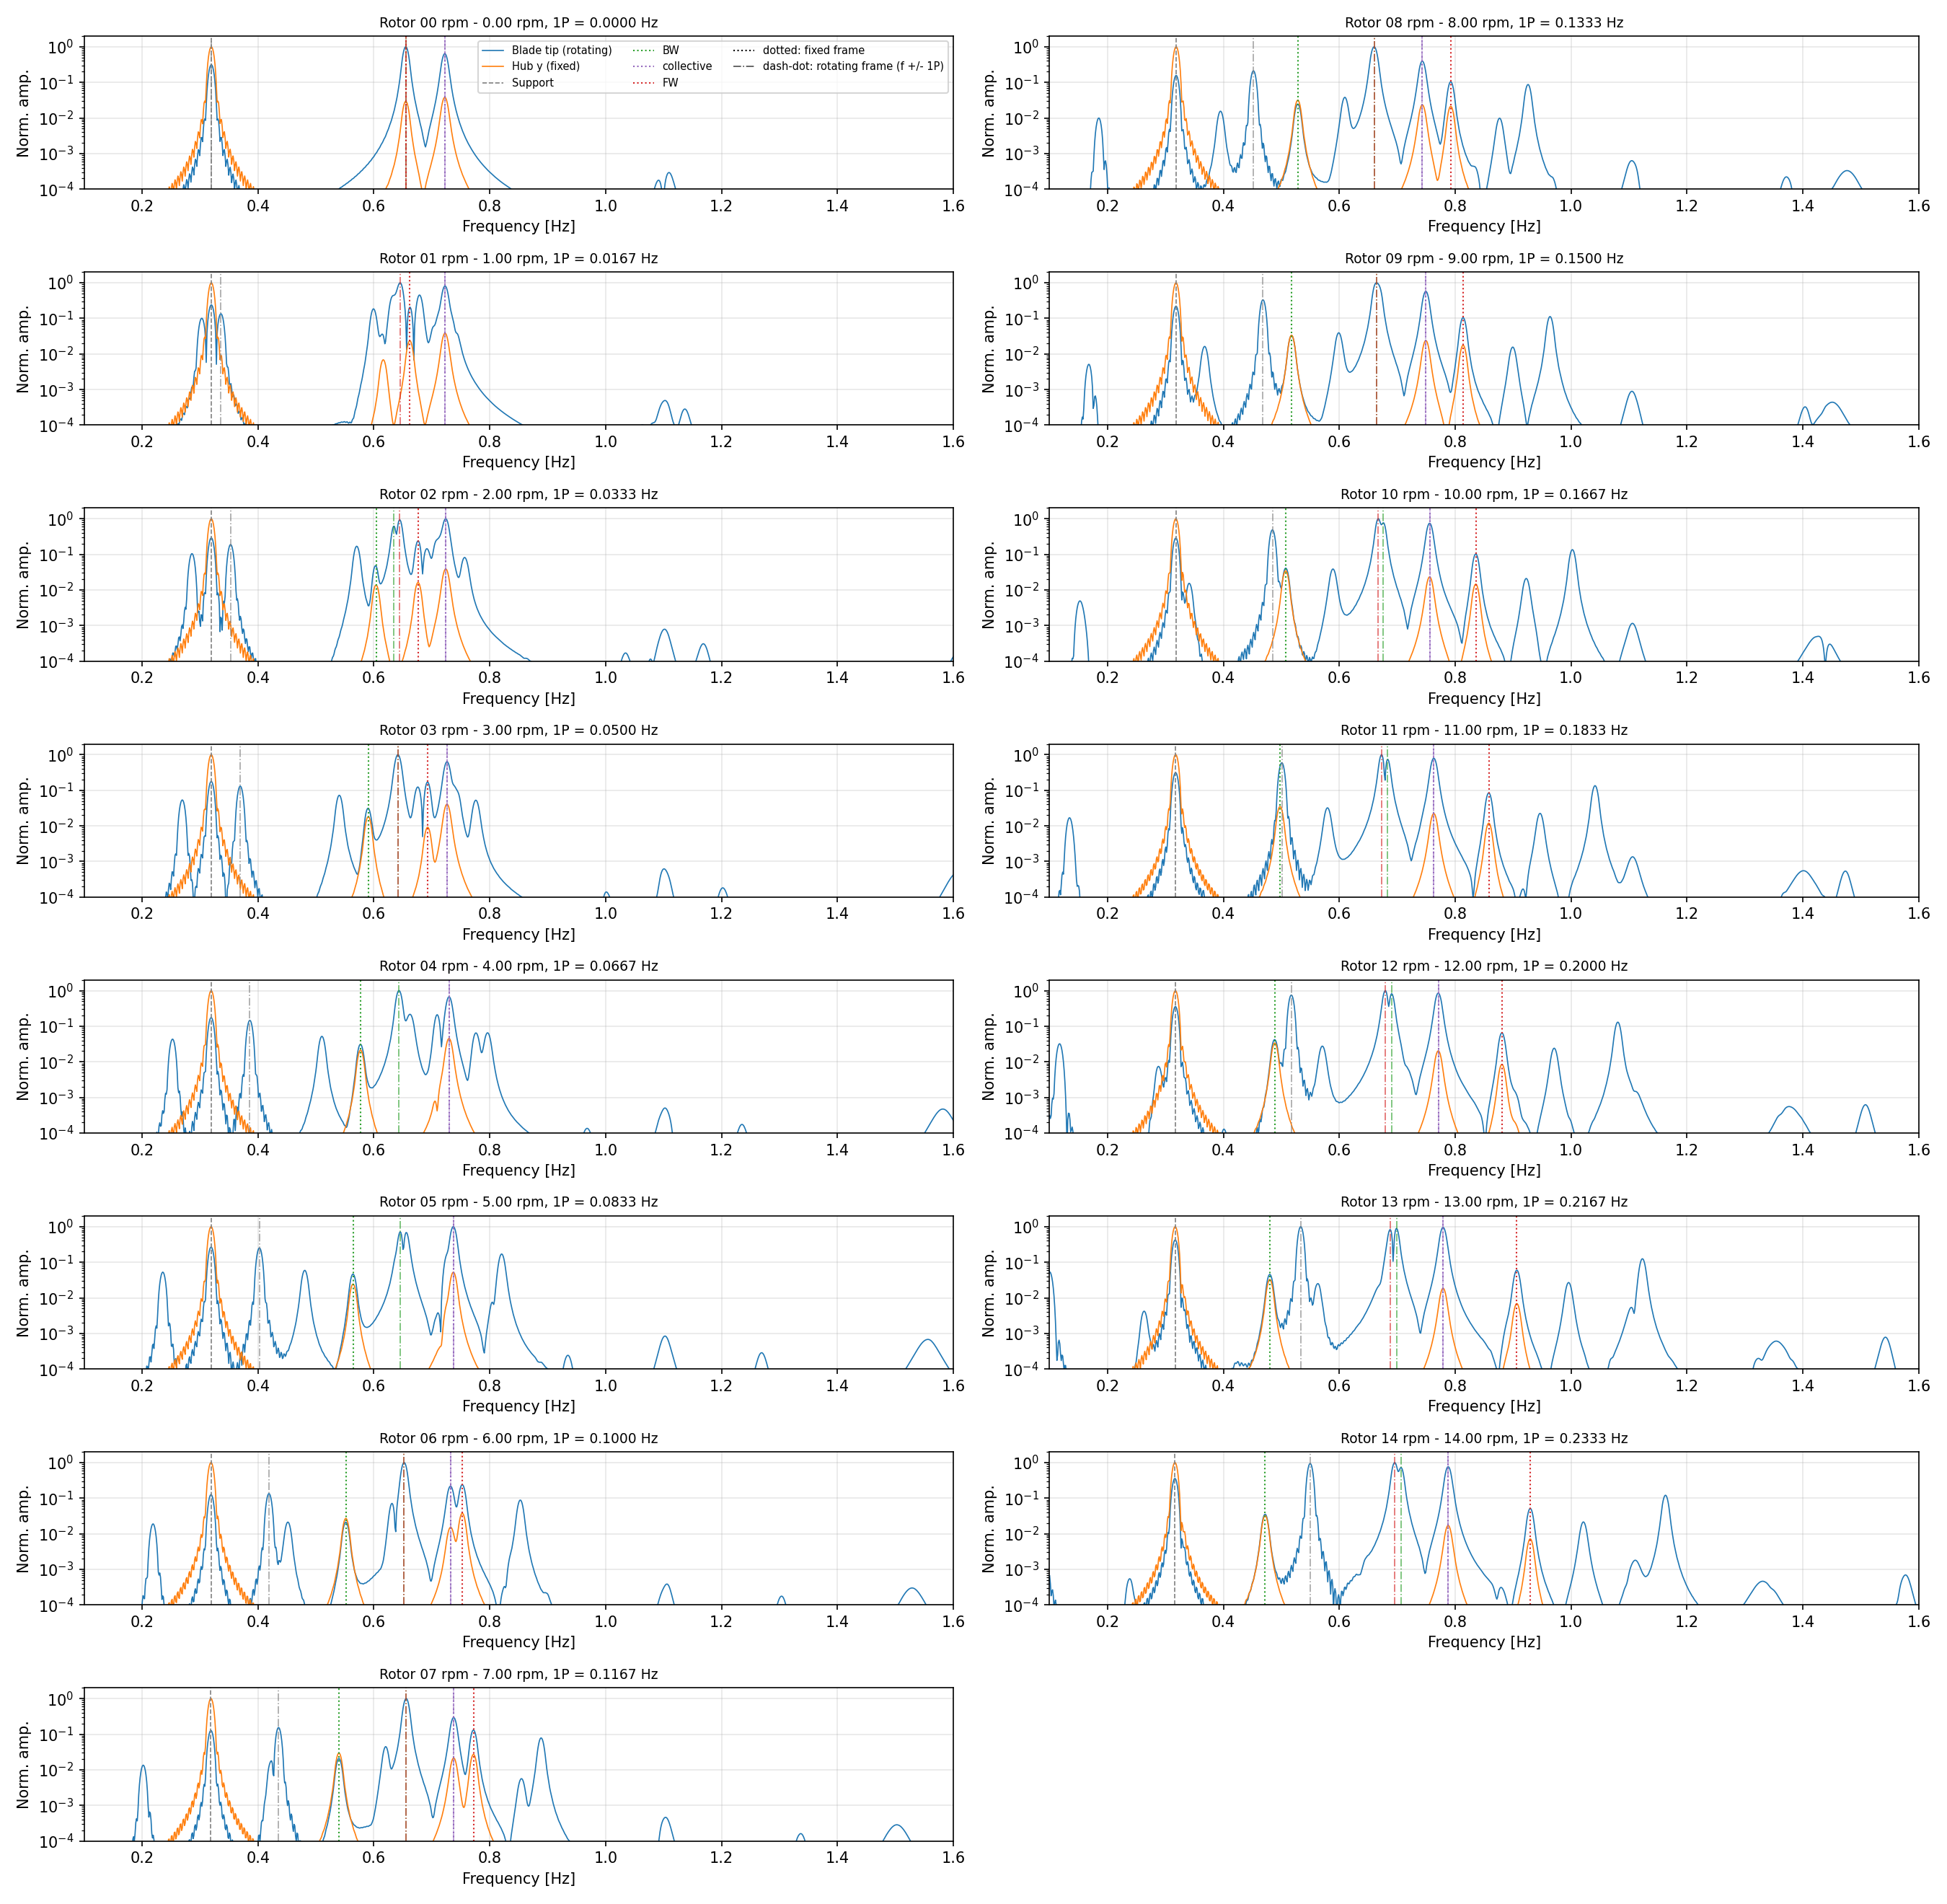
As an illustration, at 14 rpm (1P = 0.2333 Hz) the measured lines are BW fixed 0.4720 Hz / rotating 0.7065 Hz, collective 0.7879 Hz in both frames, and FW fixed 0.9295 Hz / rotating 0.6956 Hz. Because the whirl split (2P) is a small fraction of the frequency itself, the BW and FW lines, well separated in the fixed frame, sit almost on top of each other in the rotating frame - they are the same rotating blade mode seen with a different inter-blade phase.
Standstill and near-standstill. At the lowest rotor speeds the whirl split 2P falls below the spectral resolution of a 200 s decay (about 0.02 Hz, from the main-lobe width of the Hann window used), and at exactly zero rpm the rotating frame is the fixed frame, so all three sidebands of every mode coincide. Such a load case is treated as degenerate: the BW/FW split cannot be resolved and is reported as a single line, the two lowest fixed-frame peaks of the flapwise band being identified as the (degenerate) whirl pair and the collective mode, in that frequency order.
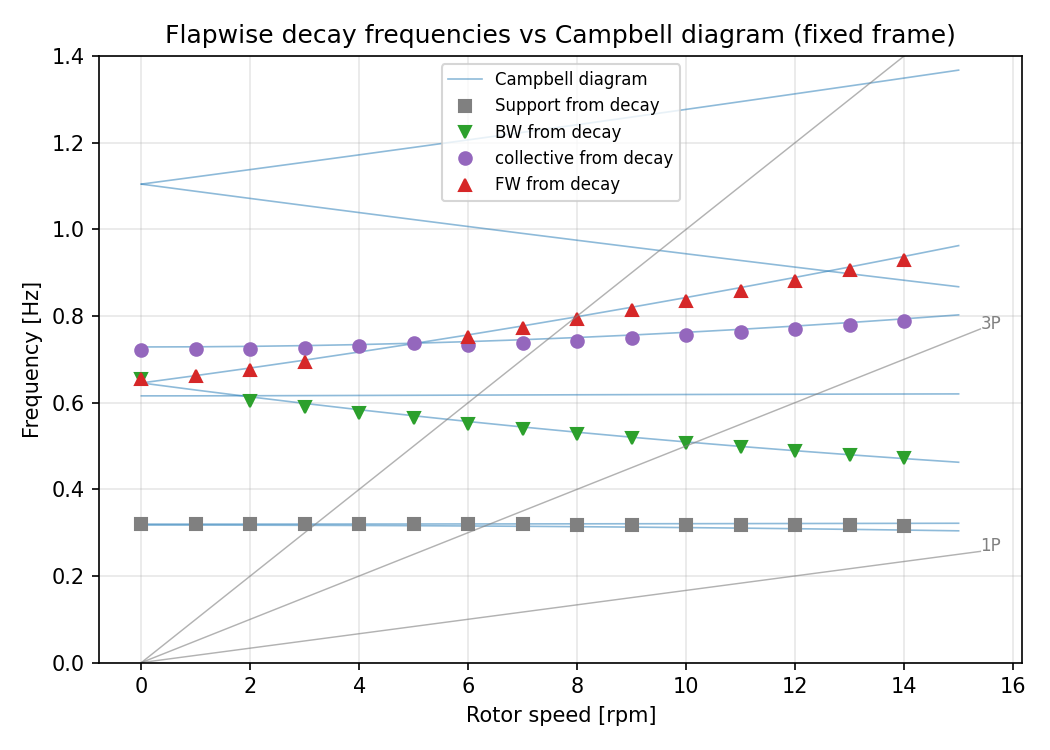
Mode crossings. Sweeping the rotor speed down to standstill also crosses the rotor speeds at which the flapwise lines cross their neighbours: the FW line crosses the collective line near 5 rpm (about 0.0007 Hz apart there), and the BW line crosses another mode near 0.616 Hz below about 2 rpm. Two lines closer than the spectral resolution of the decay show up as a single hump and cannot be told apart; the test then checks the decay against the merged pair as a whole - the measured hump must fall inside the interval spanned by the two Campbell lines - and reports the line with no peak of its own as "not separately measurable" rather than as a missing mode. The two tower/support modes near 0.32 Hz are within this resolution at every rotor speed of the sweep and are always treated as a merged pair.
4 Results
Each fixed-frame line identified in the decay (support, flap BW, flap collective, flap FW) is compared to the Campbell diagram line of the same rotor speed and kind, interpolated on the diagram's 1 rpm grid; the test fails if any of them is off by more than 2%. Where two Campbell lines are closer together than the spectral resolution of the decay, the pair is checked as a whole instead (see above). In addition, the rotor speed must stay steady through the decay (within 2%, or 0.05 rpm absolute, whichever is larger).
In the latest passing run, all 15 load cases pass, with the worst deviation from the Campbell diagram around 1.6% (well inside the 2% tolerance); three lines (1 rpm BW, 4 rpm FW, 5 rpm FW) are reported as not separately measurable because the Campbell diagram itself puts them within the decay's spectral resolution of a neighbouring line.
The figure below overlays the measured decay frequencies on Ashes' own Campbell diagram lines, as a function of rotor speed:
The figure below shows the 15 per-load-case spectra (blade tip, rotating frame, and hub, fixed frame). Each identified mode is marked twice in its own colour: dotted at the fixed-frame frequency it was found at in the hub spectrum, and dash-dot at the frequency of the rotating-frame partner in the blade spectrum that decided its kind. The two dash-dot marks of BW and FW nearly coincide while their dotted marks are 2P apart, which is the relation above made visible; the collective's two marks land on top of each other:
The report for this test can be found on the following link: