DNV C203 S-N curves

This document shows how Ashes obtains the DNV C203 S-N curves (see DNV-RP-C203 (2016)) from the category as given in the Preferences in Ashes. The Eurocode curves are described in Eurocode1993 S-N curves.

Ashes comes with two collections of DNV curves, one for each environment:

  • DNV-RP-C203 in air, from table 2-1 of the recommended practice
  • DNV-RP-C203 in seawater with cathodic protection, from table 2-2

Each collection has the categories B1, B2, C, C1, C2, D, E, F, F1, F3, G, W1, W2, W3 and T.

Note: unlike in the Eurocode, a DNV category is a letter and not a reference stress. The curve of a category is given by the coefficients listed for it in the tables of the recommended practice.

1 Equation of the curves

A curve is made of two straight lines in a log-log plot, as shown in the figure below for category D:
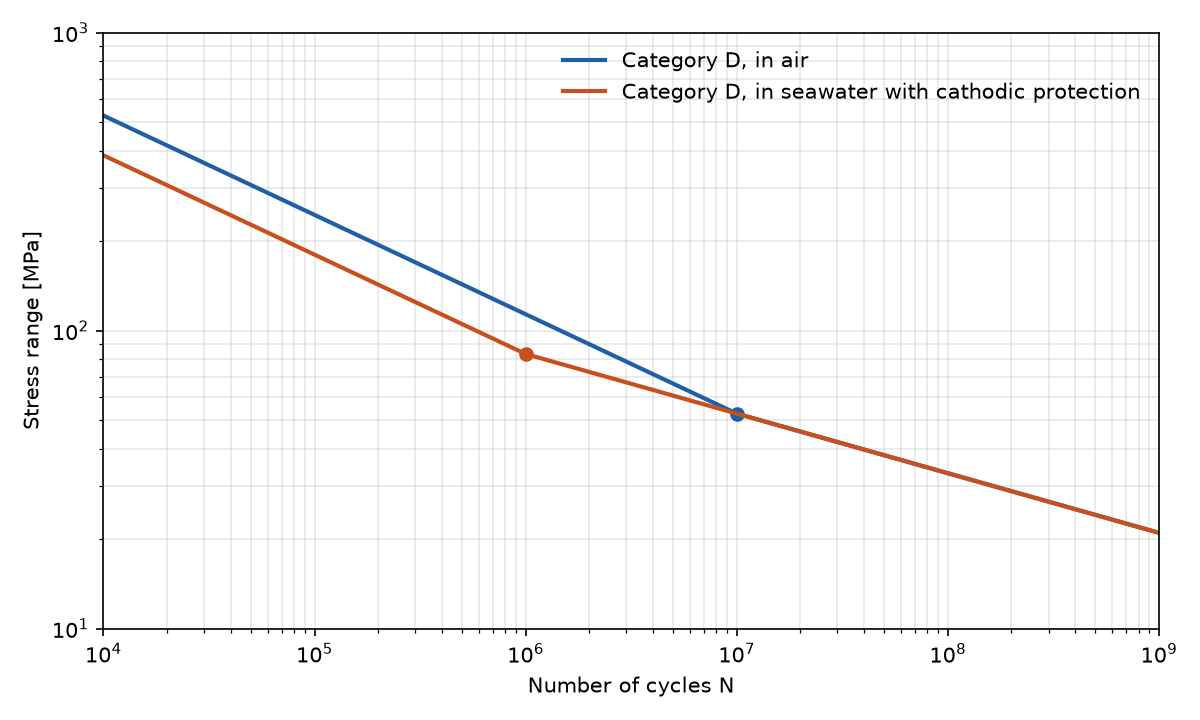
S-N curves of category D in air and in seawater with cathodic protection: two straight lines each in a log-log plot, changing slope at 10^7 and 10^6 cycles
On line
\(i\)
, the number of cycles to failure
\(N\)
for a stress range
\(\Delta\sigma\)
[MPa] is given by
$$\log_{10}N=\log_{10}a_i-m_i\cdot\log_{10}\Delta\sigma$$
where
\(m_1\)
,
\(\log_{10}a_1\)
,
\(m_2\)
and
\(\log_{10}a_2\)
are the values the tables give for the category.
The first line applies up to the number of cycles at which the slope changes, and the second line beyond it. The slope changes at
\(N=10^7\)
in air and at
\(N=10^6\)
in seawater with cathodic protection. The two lines meet at that point.

2 Example: category D

The coefficients of category D are:

Environment m1 log10 a1 m2 log10 a2 Change of slope [cycles]
In air 3.0 12.164 5.0 15.606 107
In seawater with cathodic protection 3.0 11.764 5.0 15.606 106
In air, a stress range of 100 MPa is on the first line and gives
\(\log_{10}N=12.164-3\cdot2=6.164\)
, that is about
\(1.46\cdot10^6\)
cycles. In seawater with cathodic protection the same stress range gives
\(\log_{10}N=11.764-3\cdot2=5.764\)
, about 2.5 times fewer cycles. The second line is the same in both environments, as the figure shows.

3 Plotting a curve

The script on the following link plots a curve from its four coefficients and the number of cycles at which the slope changes. The values in it are those of category D in seawater with cathodic protection:

https://www.simis.io/downloads/open/Open%20scripts/sn_curve_plot.py